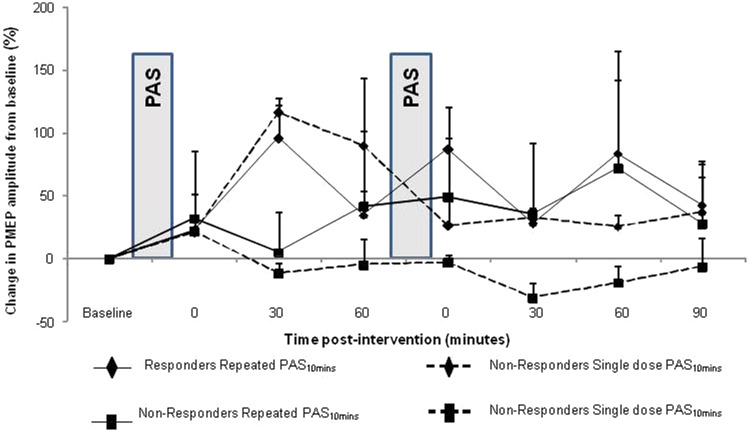
Figure 3.
Group mean percentage change in PMEPs amplitude on the ‘stronger’ (stimulated) pharyngeal motor representation following repeated (■) and single (♦) PAS in ‘responders’ (solid line) and ‘non-responders’ (dashed line). Both ‘responders’ and ‘non-responders’ presented the same within group change in excitability after the initial PAS across the two study arms. Differences in responses are observed for both groups after the application of repeated PAS10min, here compared to the responses after single application of PAS10min for each group.

