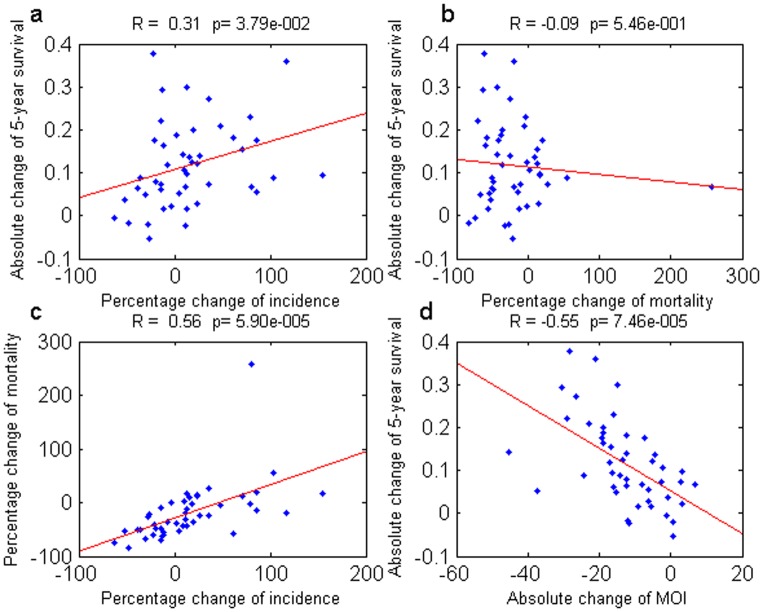
Figure 1. Correlations between different measures for the US dataset.
(a) Change in 5-year survival versus change in mortality. (b) Change in 5-year survival versus change in incidence. (c) Change in mortality versus change in incidence. (d) Change in the 5-year survival versus change in mortality over incidence (MOI). The Pearson's correlation coefficient (R) and its p-value are displayed on top of each panel. The change in 5-year survival is strongly linearly associated with the change in MOI.

