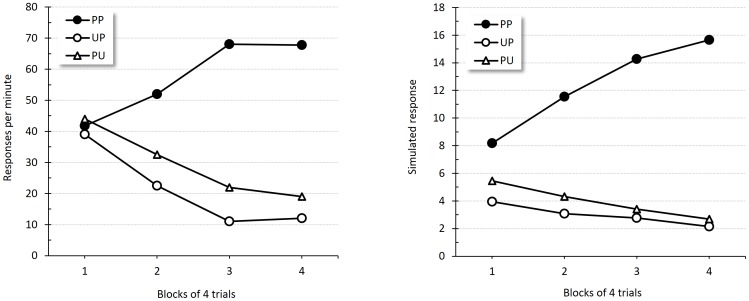
Figure 3. Second-order conditioning.
Empirical (original measurement units) and simulated results during second-order conditioning test. Left panel reproduces the group mean response rates to the click across 4-trial blocks during test, adapted from Holland and Rescorla's Experiment 1 [57]. The right panel shows the corresponding simulated responses per minute.

