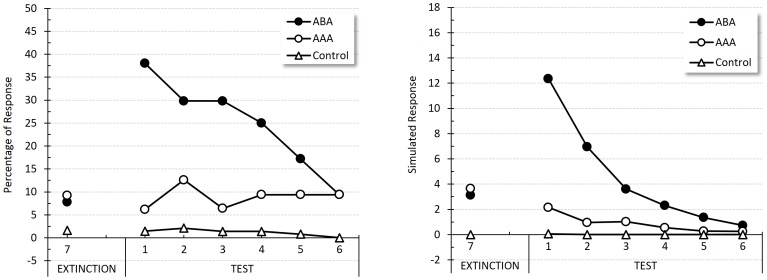
Figure 7. Renewal.
Empirical (original measurement units) and simulated results during the last extinction block and during the test. Left panel reproduces an adaptation of Bouton and Peck's percentage of responses to the tone for Group ABA, Group AAA and Group Control in Experiment 1 [66]. Right panel shows the corresponding simulated responses per minute for each group and block of trials.

