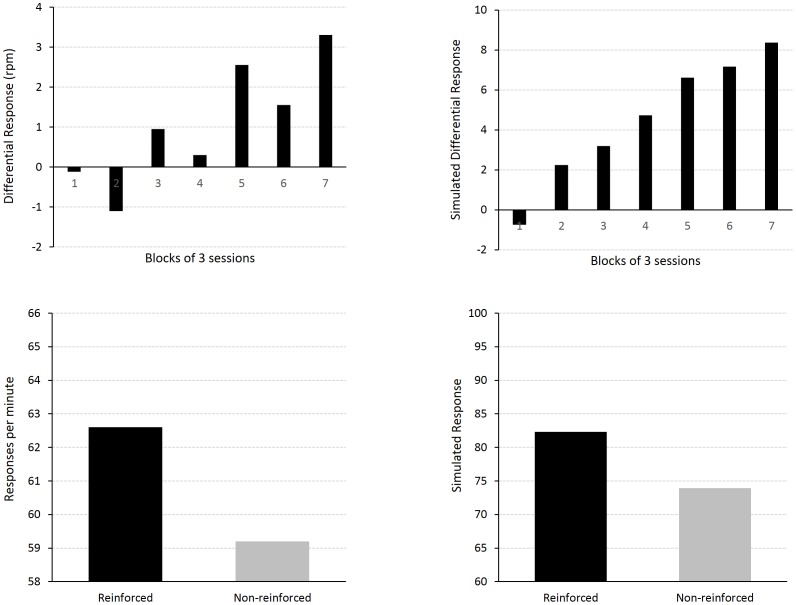
Figure 11. Serial structural discrimination.
Empirical (original measurement units) and simulated results during Murphy et al.'s serial structural discrimination training (Experiment 1a) [46]. The top-left panel shows mean differential responses to the reinforced and non-reinforced trials across blocks of 3 sessions. In the bottom-left panel, mean responses per minute to the reinforced and to the non-reinforced compounds during the last training session are displayed. The right panel presents the corresponding simulated responses.

