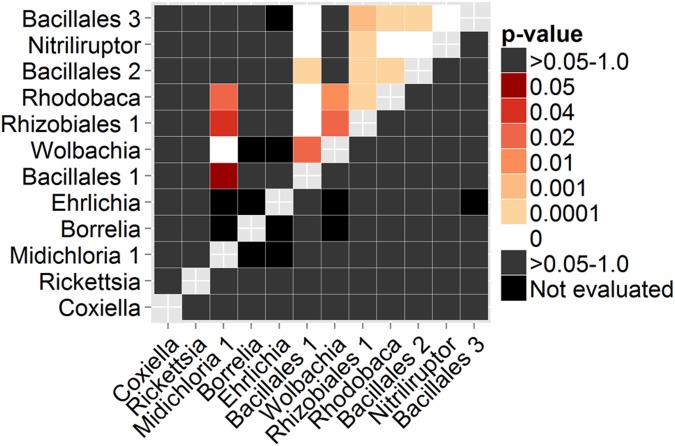
Figure 3. Significance of co-infection patterns between selected operational taxonomic units (OTUs).
Only data from the Georgia tick DNA sample collection is shown. The upper triangle represents p-values of positive associations (codetection in the same sample) between OTUs and the lower triangle the p-values of negative associations. Black cells were not evaluated due to low expected co-occurrence (<1) between the OTUs [49].

