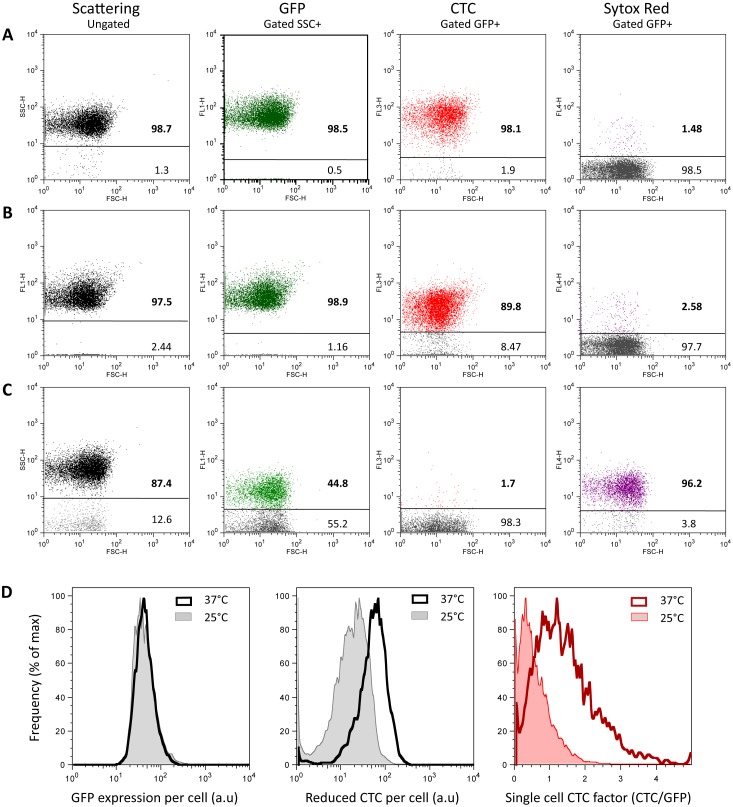
Figure 1. FCM signature of cell respiration down-modulation.
Side scattering (SSC, first row) and fluorescence (FL1, second column; FL3, third column; FL4, fourth column) versus forward scattering (FSC) dot plots of bacteria constitutively expressing GFP and labelled with CTC or Sytox red are shown for cells (A) freshly taken from 37°C agitated culture, (B) left to rest at 25°C or (C) fixed in 3.7% formaldehyde. Fluorescence dot plots are from cells exhibiting a positive side scattering signal (>10 a.u). Cell frequencies below and above a fluorescence intensity threshold taken between 4 and 5 a.u. in each channel are indicated on the dot plots (see also Table 1 for fluorescence intensity data). (D) Histograms of fluorescence intensity distribution for GFP expression (left graph), CTC reduction (middle graph) and single cell respiration index (right graph) for cells freshly taken from 37°C agitated culture and left to rest at 25°C.

