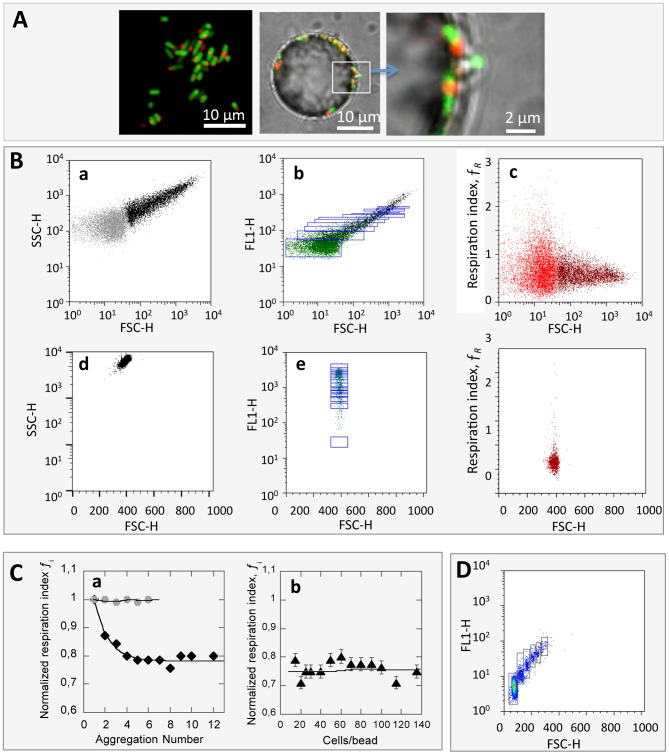
Figure 3. Adherent and aggregated cell respiration down-modulation upon contact.
(A) Microscope images of CTC labelled cells in suspension and adhering to the 25 µm diameter particle surface. (B) FCM dot plots: SSC (left panels), FL1 (middle panels) and respiration index f R (right panels) versus FSC showing cells (upper row, a to c) — single free-floating cells appear as light gray dots, aggregates as dark dots — and cells adhering to particles (lower row, d to f)); FL1 dot plots (middle panels) reporting GFP expression show cell counting gates, from R2 to R12 for aggregates and from R10 to R135 for particles. Gates were defined as explained in the text based on sample single cell mean FL1 value. (C) Graphs of normalized respiration index as a function of (a) number of cells (♦) or 2.8 µm diameter beads (•) per aggregate and (b) number of cells per particle. (D) FL1 versus FSC dot plot of 2.8 µm beads used as aggregation controls and population counting gates.

