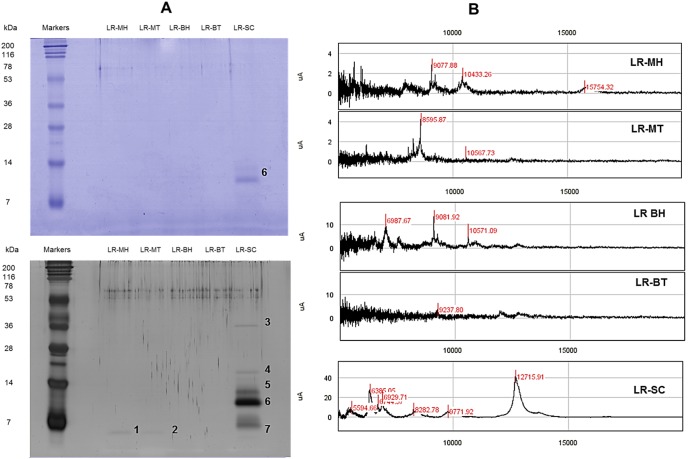
Figure 2. Protein profiling.
(A) Electrophoretic analysis of proteins in the extracts of Lignosus rhinocerotis and visualisation by Coomassie Brilliant Blue (top) and silver staining (bottom). Molecular weight (MW) of the bands was estimated from the plot of log MW vs. relative migration distance (Rf) based on the values obtained from the bands of the marker (7−200 kDa). The estimated sizes of the bands were as follows: 1, 2 (4.0 kDa), 3 (38.0 kDa), 4 (14.0 kDa), 5 (9.5 kDa), 6 (8.0 kDa), and 7 (4.7 kDa). (B) Representative SELDI-TOF-MS spectra of the low-molecular-weight proteins (5−20 kDa) in the extracts. The x-axis represents the m/z values, and the y-axis represents the intensity of the signals (µA). Peaks with signal/noise ratios (S/N) >5 were automatically detected.

