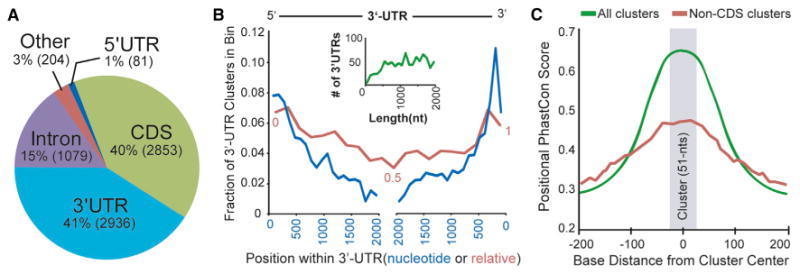
Figure 3. Positional Distribution and Conservation of Human Ago2 Brain Clusters.

(A) The intragenic distribution of the 7153 human Ago2 brain clusters within mRNAs based on Ensembl gene annotations. The actual number of clusters in each region is provided in parentheses.
(B) The actual nucleotide (blue line) and relative (red line) positional distribution of clusters within binned 3′ UTR locations is shown. The inset graph (green line) depicts the number of 3′ UTRs by length for genes containing 3′ UTR clusters, supporting that the observed decrease in clusters distant from 3′ UTR ends (both 5′ and 3′) is not length dependent.
(C) The positional PhastCon scores within and near Ago2 brain clusters (centered on zero, median cluster size is 51 nt, shaded gray) are shown for all clusters or non-CDS clusters. For the latter, Ago2 brain clusters located in CDS were removed in order to avoid a potential bias for coding regions to show increased conservation, particularly for smaller exons that would be flanked by lesser conserved intronic sequences.
