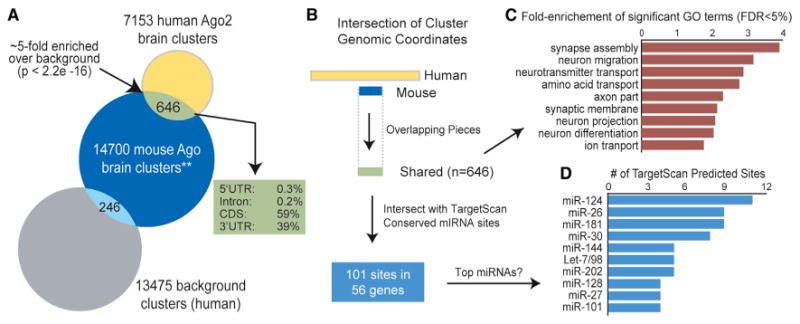
Figure 5. Intersection of Human and Mouse Brain Ago HITS-CLIP Data.

(A) Venn diagram of the number of human Ago2 brain clusters overlapping with the mouse Ago HITS-CLIP brain data (**, ternary map data of miRNA binding sites spanning 7 nt, further described in the Experimental Procedures) (Chi et al., 2009). The number of overlapping human background clusters (i.e., regions up- and downstream of the Ago2 brain clusters; see the Supplemental Information) is provided as a control.
(B) Schematic depicting the processing of overlapping human (≥ 50 nt) and mouse (7 nt) brain Ago HITS-CLIP clusters.
(C) Gene ontology analysis was performed with the genes that harbor “shared” clusters as input relative to all genes containing clusters as background.
(D) The overlapping regions were intersected with TargetScan-predicted conserved miRNA binding sites, and the top represented miRNAs (by number of sites) are shown.
See also Figure S5.
