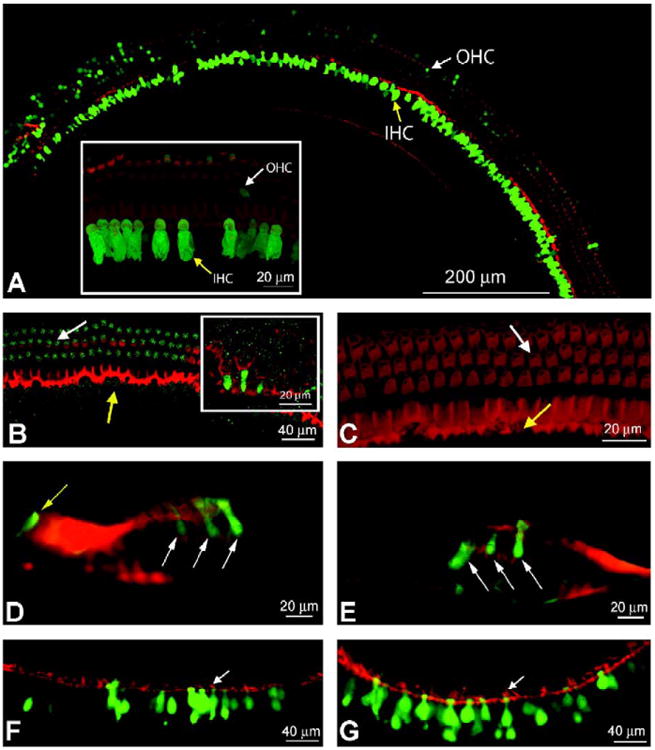
Fig. 3.

Long-term gene expression in IHCs and OHCs. Confocal images of mature cochleae after in utero microsurgical viral injection. (A) A composite image of an apical turn is seen under confocal microscopy at original magnification 25×. Phalloidin, which stains F-actin in hair cells and supporting cells, appears red. A fragment of the cochlear turn is seen at original magnification 63× in the inset, which shows inner and outer hair cells that were transduced and express eGFP. Both images are of a cochlea injected with AAV2/1. White arrows mark OHCs and yellow arrows indicate transduced IHCs. (B) A segment of apical turn from a cochlea injected with lentivirus is seen at original magnification 25×. Three rows of OHCs are observed with a low level of eGFP expression. No IHCs are expressing eGFP. A 63× original magnification inset shows green fluorescent supporting cells indicating viral transduction. (C) A confocal projection image from an uninjected negative control at original magnification 63×. It is stained with phalloidin and exposed at a gain similar to that of the cochlear turn in (B) to demonstrate staining above background in (B). (D and E) AAV2/1- and 2/8-injected modiolar cross sections, respectively, at original magnification 40× are seen under light microscopy. The white arrows indicate infected OHCs and the yellow arrow indicates an infected IHC. (F and G) AAV2/1- and 2/8-injected utricular sections are seen at original magnification 20× under light microscopy. Many green fluorescent hair cells and supporting cells are observed. White arrows point to hair cell stereociliae as an indicator of hair cells. In several images, the cuticular plate can be distinguished by its yellow colabeling.
