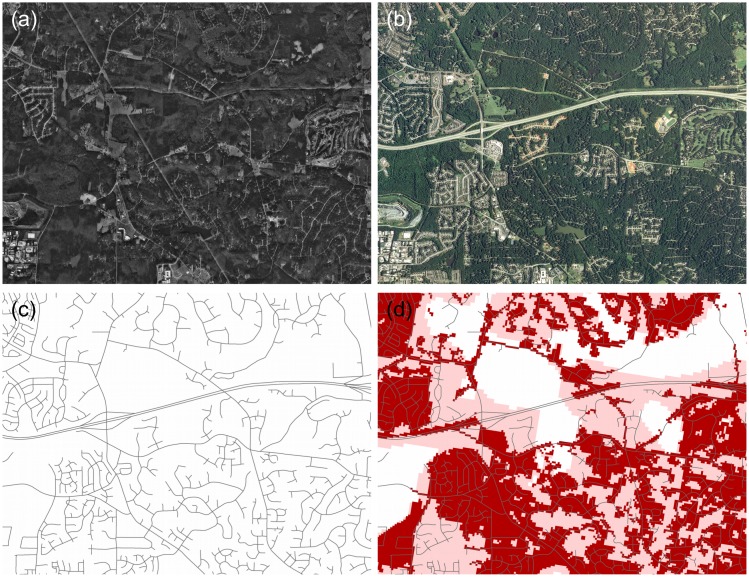
Figure 2. Urban sprawl examples and their representation in the input data.
Imagery in (a) and (b) document the rapid but low-density urbanization common in the Southeast US (imagery for Raleigh, NC in 1993 and 2010). (c) Road network used as basis for identifying urban areas (same area as in (a) and (b)). (d) Initial (2009) urban classification (pink shade) based on road network density and NLCD urban classification (red shade).

