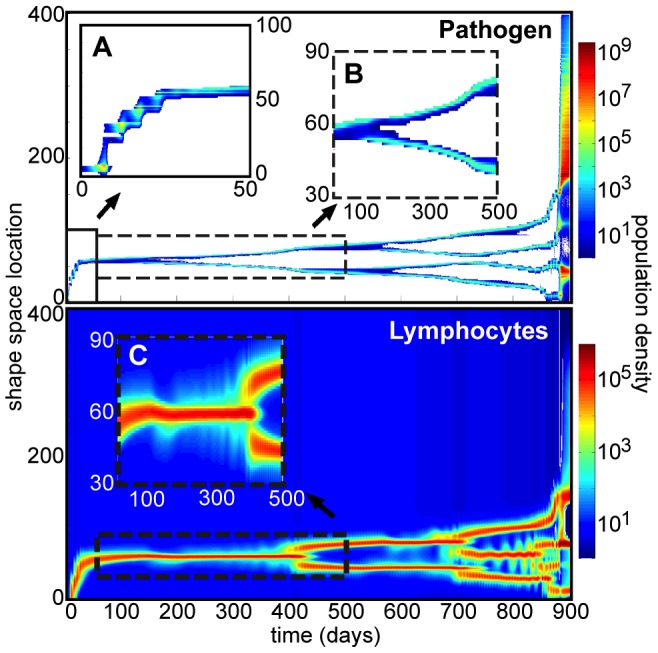
Figure 1. Coevolving shape space distributions of pathogen and T-cell populations over 900 days of infection.

The infection shown is an example of a stochastic mutating infection. Inset A (days 0–50) highlights the early periodic bursts of pathogen mutation which lead to chronic infection rather than clearance, driven by peaks in pathogen density which are subsequently controlled by the immune response. Insets B and C (days 50–500) provide a closer look at the chronic phase, which exhibits wave-like pathogen dynamics, pathogen speciation driven by the interaction with the immune response, and a resulting branch in T-cells, which is caused by selection alone. Following more branching, increased homeostatic pressure on the T-cells leads to the pathogens' dramatic escape from immune control (around day 870), marked by sudden rapid proliferation and unchecked diffusion throughout shape space. In this simulation,  ,
,  ,
,  ,
,  ,
,  , and all other parameters are given in Table 1.
