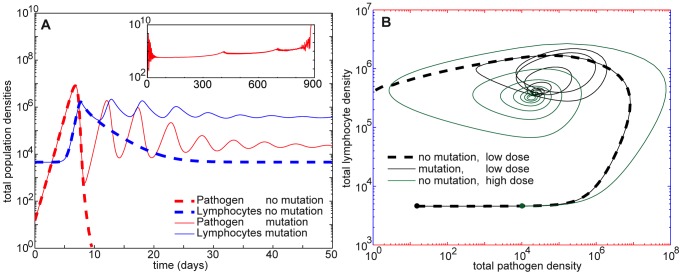
Figure 3. Coevolutionary dynamics in the first 50 days of infection.
Shown here are the mutating infection from Fig. 1 and a non-mutating infection with the same parameter values. A. Plots of total pathogen and total T-cell populations for both non-mutating (dashed) and mutating infections (solid curves). When there is no mutation, the pathogen density decays below the threshold and is set to zero. With mutation, pathogens escape clearance as strains arise with lower affinity to the T-cell response (see Fig. 1A). Both pathogens and T-cells then converge to an approximate equilibrium state corresponding to a chronic infection. The inset shows total mutating pathogen density for the entire 900-day infection, which displays qualitative features observed in HIV and SIV [31]; peaks in the chronic phase correspond to branching events (see Fig. 1). B. Phase plot of total T-cell versus total pathogen densities for the first 50 days of the two simulated infections in A and a third infection with a higher initial dose of pathogens. Of the low-dose infections, only the mutating case escapes clearance, converging to a chronic state similar to the approximate steady state (Eq. 12) existing in the non-mutating system. Parameters are given in Table 1.

