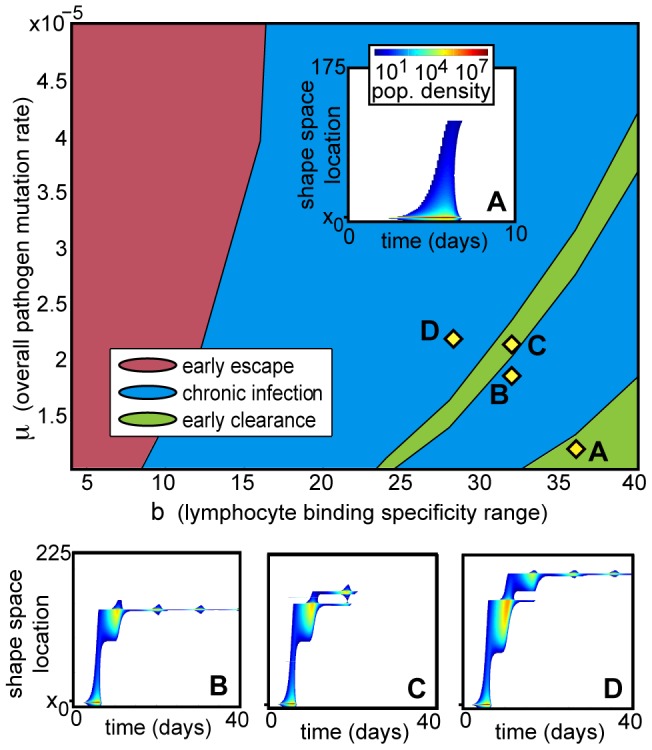
Figure 4. Phase diagram of deterministic infection trajectories under low homeostatic pressure, as a function of mutation rate  and T-cell specificity range
  .
.

In most cases, infections with a higher mutation rate in systems with narrower immune specificity range (i.e. higher  and lower
  ) are more successful at avoiding early clearance, but a band of cleared infections in the otherwise chronic regime highlights a trade-off: pathogen must mutate fast enough to evade an existing immune response, while keeping mutant numbers low enough to avoid stimulating another. A. Shape space distribution of pathogen infection with a low mutation rate: the original inoculation and all mutants are killed by the initial immune response. B. A faster mutation rate and narrower immune response allows pathogen mutants to avoid the initial immune response and establish a chronic infection. C. As mutation rate increases and specificity range narrows, an increased number of pathogens avoid the initial immune response; this stimulates a more effective secondary response, which is able to clear the entire mutant population. D. Chronic infection is established at a higher mutation rate when the secondary pathogen peak is able to establish mutants that can evade the secondary immune response. All infections have
  ; other parameters are given in Table 1.
