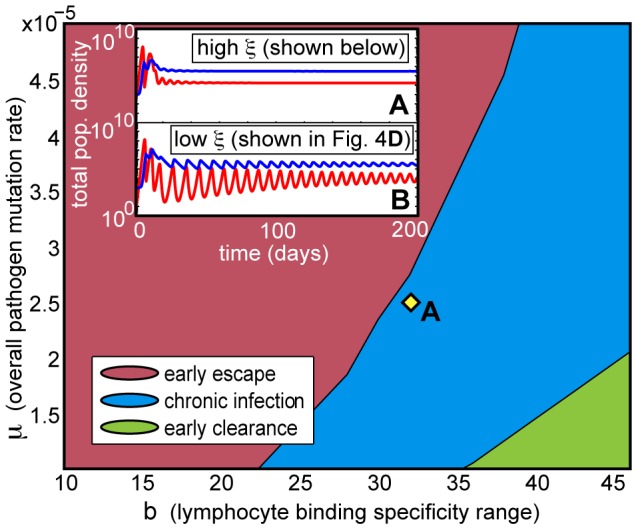
Figure 5. Phase diagram of deterministic infection trajectories under high homeostatic pressure.

Relative to Fig. 4, this increased pressure ( for all infections in the main phase diagram) has the overall effect of suppressing the immune response, allowing early escape and chronic infection to occur at lower pathogen mutation rates (
 ) and larger affinity ranges (
 ). In addition, as shown in the insets, convergence to the approximate steady state of chronic infection occurs much more quickly under high homeostatic pressure (inset A), due to the damping effect of the homeostatic constraint on population oscillations. Inset B shows population densities for an infection with low homeostatic pressure from Fig. 4D; these display stronger, more sustained oscillations. Inset A and infection A have
  and
and  sites. Inset B and its corresponding infection in Fig. 4D have
  ,
,  , and
, and  sites. All other parameter values are specified in Table 1.
