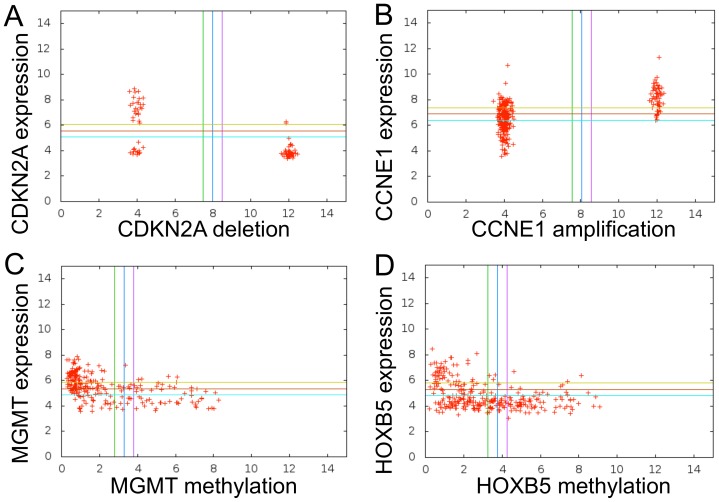
Figure 3. Boolean Implications Between Copy Number Alterations/DNA Methylation and Expression of the Same Gene.
Boolean implications between variables are easily verified by inspecting scatter plots. Data for deletions and amplifications were rescaled: a value of 12 implies gene deletion or amplification; a value of 4 implies no somatic copy number change for the gene. Gaussian noise was added so the points do not fall exactly on 4 and 12 to allow easier visualization. The beta-values of methylation (which is how TCGA reports methylation data) were scaled by a factor of 10. (A) HILO Boolean Implication between CDKN2A deletion and CDKN2A expression in TCGA GBM data set. (B) HIHI Boolean Implication between CCNE1 amplification and CCNE1 expression in TCGA OV data set. (B) HILO Boolean Implication between MGMT methylation and MGMT expression in TCGA GBM data set. (D) HILO Boolean Implication between HOXB5 methylation and HOXB5 expression in TCGA OV data set.

