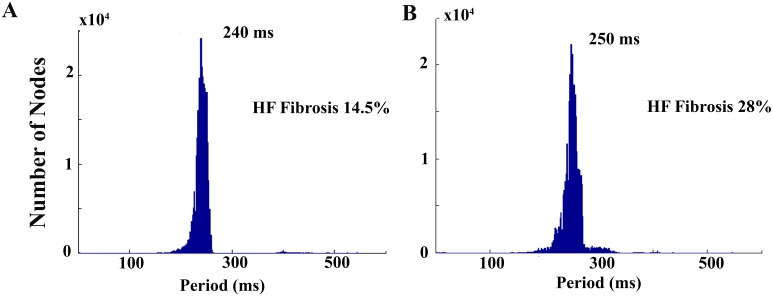
Figure 5. Spiral waves periods.
Using the information of the AP upstroke in all points of the sheet, histograms of cycle lengths values measured to the nearest 1[43]. The reentrant waves generated after an S2 stimulus applied at an instant of time situated in the center of the vulnerable window (S2 applied at t = 210 ms for mild fibrosis 1 and t = 170 ms for mild fibrosis 2) were considered to build the histograms. The dominant spiral wave periods were 240 ms and 250 ms for mild fibrosis 1 and 2, respectively.

