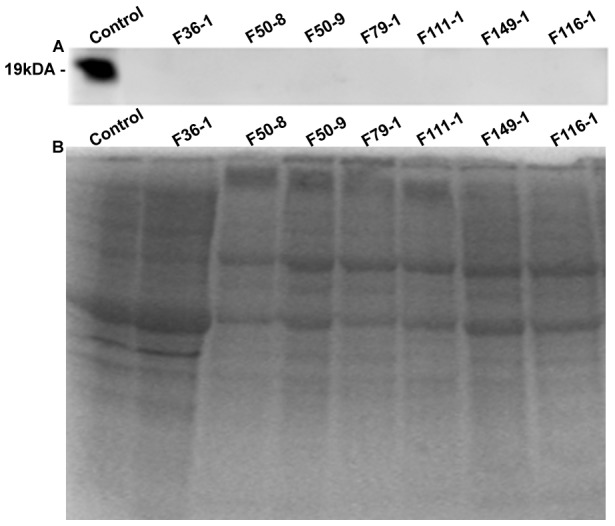
Figure 2. Western blot analysis of telethonin protein in muscle biopsies of control and telethoninopathy patients.

A. Telethonin western Blot: Lane C corresponds to non-dystrophic positive control which shows telethonin band at 19 kDa. Lanes 1–7 corresponding to the Telethoninopathy patient samples, shows complete absence of the telethonin band. B. Coomassie stained SDS PAGE (15%) profile of total muscle extract from the samples.
