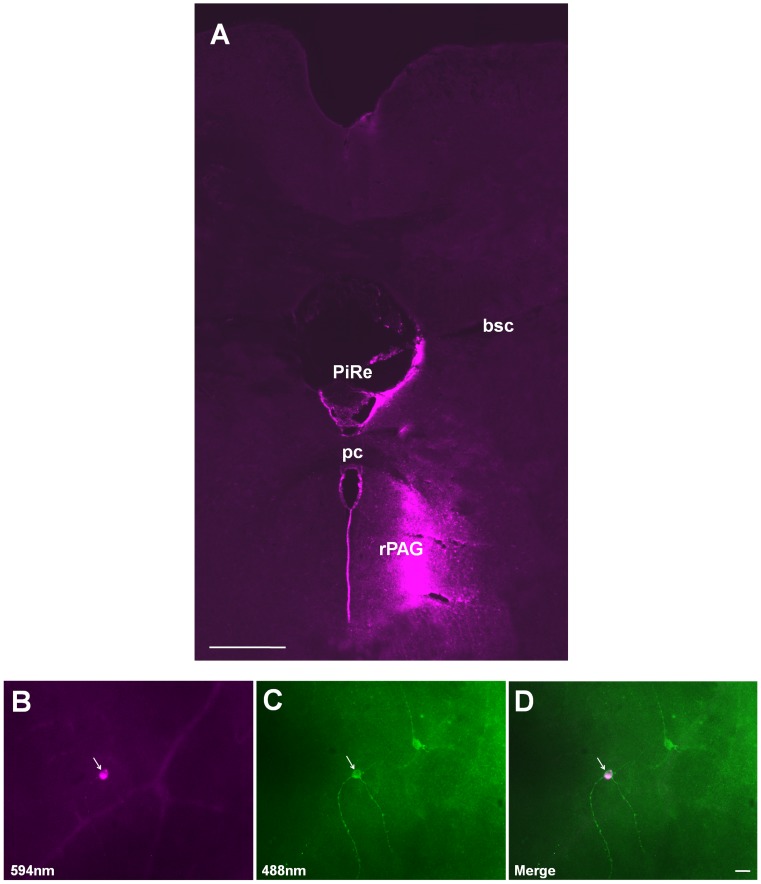
Figure 3. Innervation of melanopsin-expressing retinal ganglion cells (mRGCs) in the rostral periaqueductal gray (rPAG).
(A) Coronal section of an injection site. (B–D) Arrow points to a CTB retrogradely labeled rPAG-projecting RGC. This cell was also positive for melanopsin immunoreactivity (C), but not all mRGCs could be retrogradely labeled by CTB (arrowhead in C and D). bsc: the brachium of the superior colliculus; PiRe: pineal recess; pc: posterior commissure; rPAG: the rostral periaqueductal gray. Scale bars: 300 µm in A; 20 µm in D (applies to B and C).

