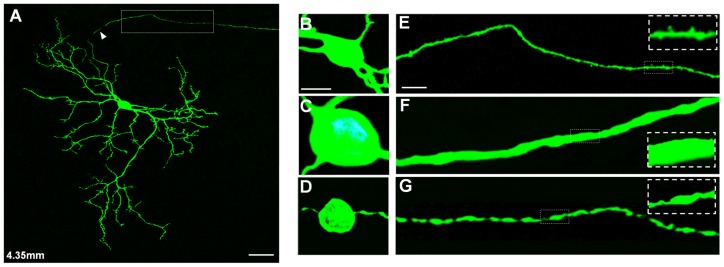
Figure 4. Details in morphology of caudal periaqueductal gray (cPAG)-projecting retinal ganglion cells (RGCs).
(A) A photomontage of cPAG-projecting RGC. This cell lies at 4.35 mm from the optic disk. The arrowhead points to an axon. (B–D) High power photomicrographs comparing somata among cPAG-projecting RGC (B), alpha cell (C) and melanopsin-expressing RGC (D). (E–G) High power photomicrographs comparing axons among cPAG-projecting RGC (E), alpha cell (F) and melanopsin-expressing RGC (G). The white frames highlight parts of their axons, respetively. Scale bars: 20 µm in A; 10 µm in B (applies to C and D); 5 µm in E (applies to F and G).

