
Figure 1. SELDI profile showed a peak with average mass of 2750-regulated in NTDs compared with control serum.
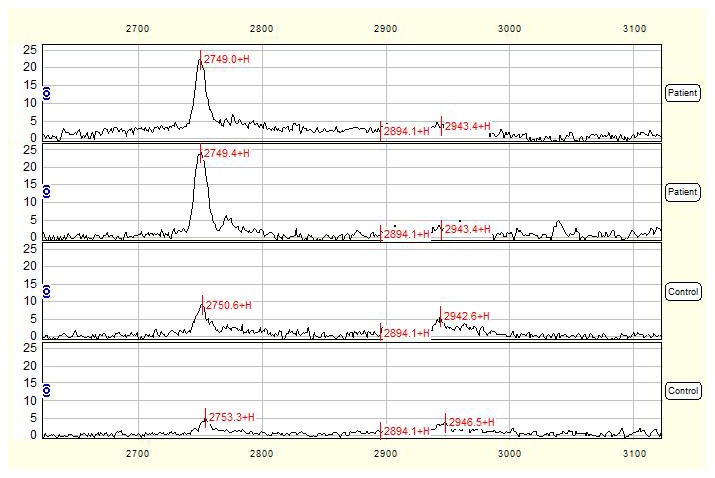
Serum mass spectra of 2 mothers with NTD-affected fetuses were compared with those of 2 control mothers and the mass-to-change ratio (m/z) ranged between 2700–3100 Da. X-axis showed molecular weight of peaks and Y-axis showed intensity of peaks.