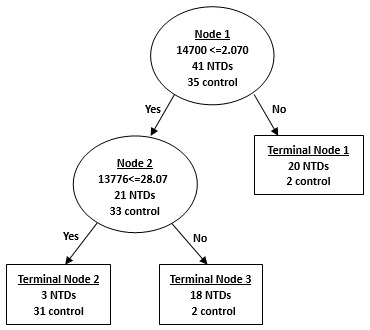
Figure 7. Diagram of a decision tree for the classification of amniotic fluid samples from the mothers with NTD-affected fetuses and control mothers.

Circles indicated primary nodes and squares indicated terminal nodes. The mass value in the root nodes was followed by ≤ the intensity value.
