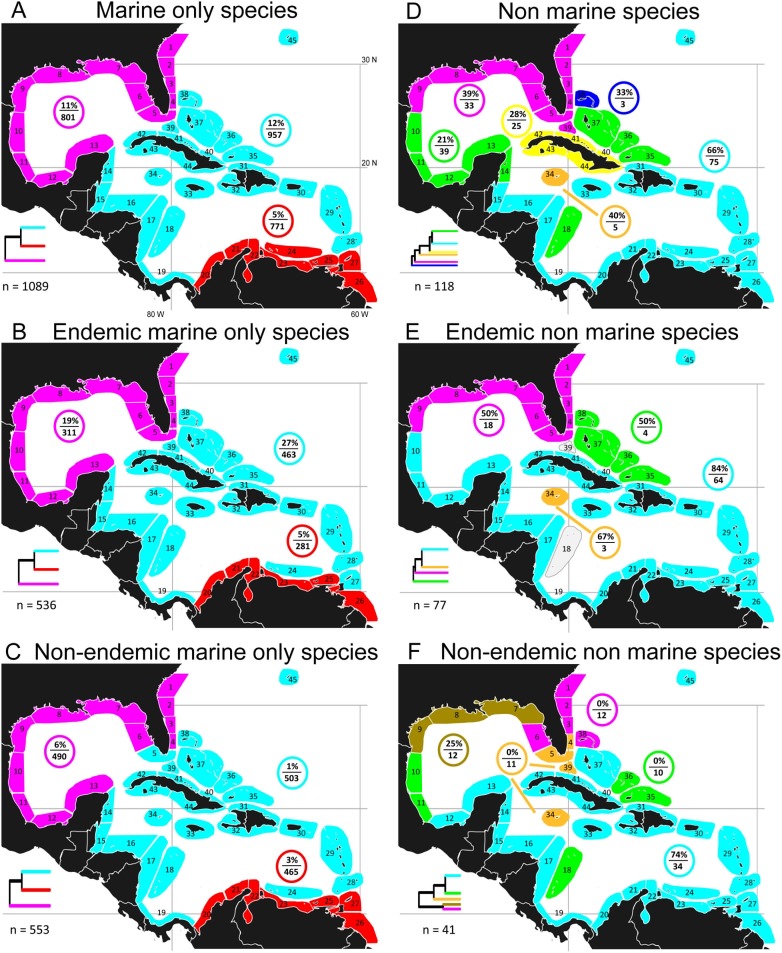
Figure 4. Optimal configuration of major clusters of sites: marine species and non-marine species.
Optimal major clusters of sites based on beta-sim dissimilarity dendrograms and evaluation curve fitting (see methods). A–F cluster patterns for subsets of the whole fauna. A–C: all marine species, and their endemic and non-endemic members; D–F: all non-marine species, and their endemic and non-endemic members; %/n in colored circle indicates % of species unique to that cluster and no. species in the cluster; n = total number of species; each dendrogram is a schematic based on the corresponding whole dendrogram in Figure S5, indicating relationships between the major clusters.

