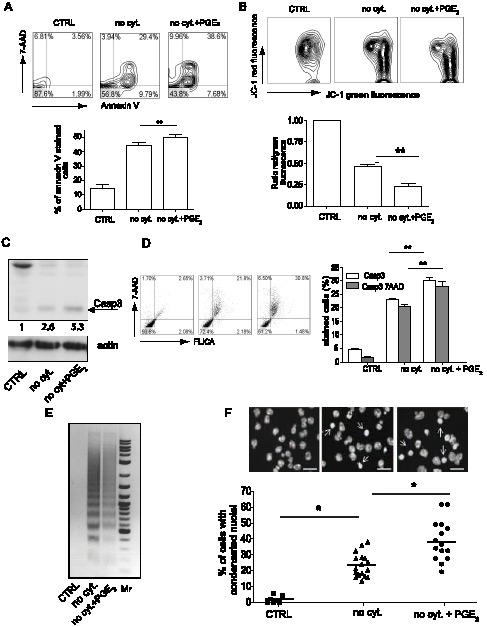
Figure 2. PGE2 increases apoptosis induced by cytokines withdrawal.

A. Double staining of BMMC with 7-AAD and APC-Annexin V (upper panel), and its quantitative analysis (lower panel). Data are from 8 independent experiments using 2 cultures of WT BMMC. B. FACS analysis of the mitochondrial potential measured as fluorescence intensity of JC-1 staining (upper panel), and its quantitative analysis expressed as a ratio of red fluorescence (FL-2 channel) and green fluorescence (FL-1 channel). Ratios were normalized to CTRL samples in each experiment (lower panel). Data are from 5 independent experiments using 1 culture of WT BMMC. C. Representative western blot analysis from 3 independent experiments using 1 culture of WT BMMC of caspase-3 activation measured by the presence of a cleaved p17 fragment in BMMC (upper panel), arrow indicates p17 fragment. Anti-actin antibody was used as a loading control (lower panel). D. FACS analysis of BMMC stained with 7-AAD and FLICA for caspase-3 activity (left panel), and its quantitative analysis (right panel). Data are from 5 independent experiments and 1 culture of WT BMMC. E. Agarose gel analysis of the DNA fragmentation assay in BMMC. Mr stands for 2-Log DNA Ladder. Data are from 3 independent experiment and 1 culture of WT BMMC. F. Chromatin condensation in BMMC stained with DAPI (upper panel), and quantitative analysis (lower panel). Figures were captured by an Olympus BX61 upright fluorescence microscope with 40× objectives with a Hamamatsu ORCA RC camera, operated by Velocity software (PerkinElmer Life and Analytical Sciences). Bars in insets represent 10 µm; arrows show condensed nuclei. Data are from 15 independent experiments using 3 culture of WT BMMC. Samples: BMMC cultured in complete medium (CTRL), BMMC cultures in medium without cytokines (no cyt.), BMMC treated with 10−6 M PGE2 and cultured in medium without cytokines (no cyt. + PGE2). Student's two-tailed t test was used to evaluate statistical differences between cytokine deprive mast cells and cytokine deprived mast cells treated with PGE2 in B and D. Statistical significance: * = P<0.05, ** = P<0.01.
