
Figure 5. PGE2-driven increase in apoptosis is dependent on intracellular calcium release and activation of MAPK.
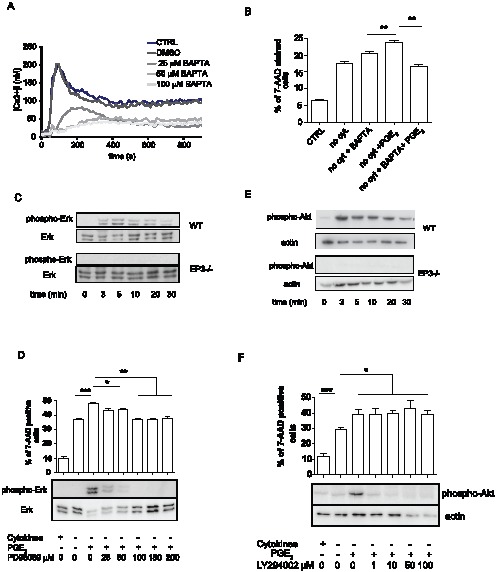
A. Intracellular calcium release after stimulation with 1×10⁻⁶ M PGE2 in untreated BMMC or in BMMC treated with various concentrations of BAPTA. Data is representative of 3 independent experiments of 1 WT BMMC culture. B. Ability of BAPTA to inhibit PGE2 mediated augmentation of cell apoptosis after cytokine withdrawal. Cell were treated as indicated with 25 µM BAPTA for 5 min follow by 1×10⁻⁶ M treatment with PGE2 for 20 min. Cell death was assessed at 16 h of depletion by staining with 7AAD. Data are from 5 independent experiments using 1 culture of WT BMMC. C. Time course of Erk1/2 phosphorylation in WT and EP3−/− BMMC stimulated with 1×10⁻⁶ M PGE2, representative of 3 independent experiments is shown. D. Pharmacological inhibition of PGE2-triggered Erk1/2 phosphorylation (lower panel) and increase in apoptosis (upper panel). BMMC were activated by 1×10⁻⁶ M PGE2. For inhibition, cells were pretreated with various concentrations of PD98059 for 10 min before PGE2 activation, n = 5 independent experiment of 2 culture of BMMC. E. Time course of Akt phosphorylation in WT and EP3−/− BMMC stimulated with 1×10⁻⁶ M PGE2, n = 3 independent experiment of 1 culture. F. Pharmacological inhibition of Akt phosphorylation triggered by PGE2 (lower panel) and increase in apoptosis (upper panel), BMMC were activated by 1×10⁻⁶ M PGE2. For inhibition, cells were pretreated with various concentration of LY294002 for 10 min before PGE2 activation, n = 6 independent experiments of 2 culture of BMMC. Differences between groups in B were evaluated by Student's two-way t-test, for D and F ANOVA test was used. Statistical significance: * = P<0.05, ** = P<0.01, *** = P<0.001.