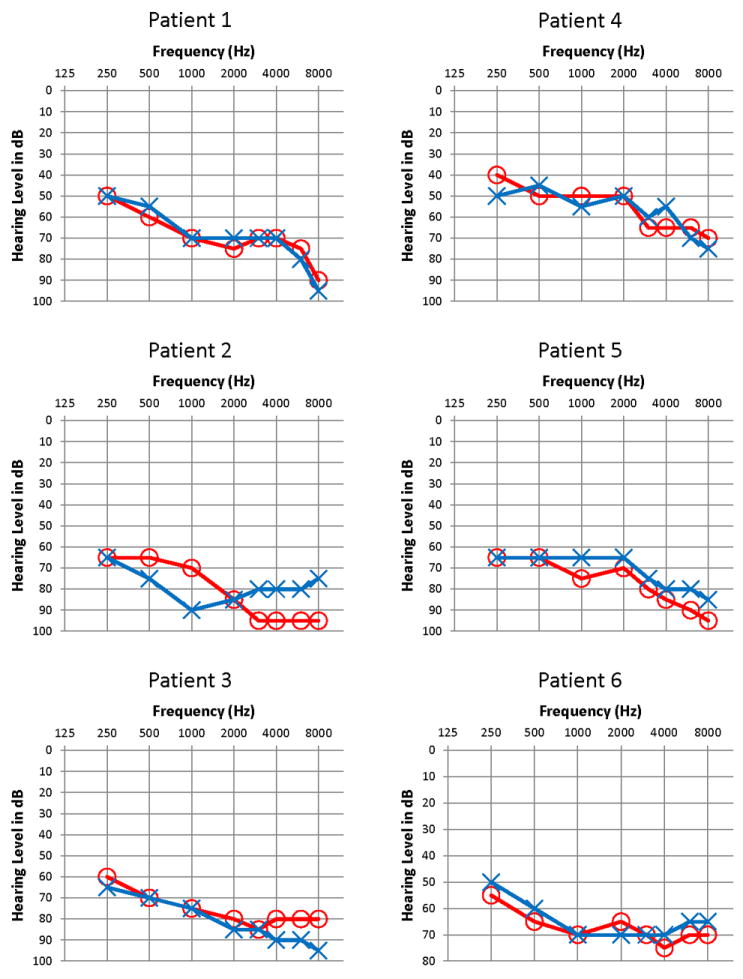
Figure 1.

Pure tone audiograms in patients with GATA3 mutation. The right ear thresholds are shown in red (circles), and the left ear thresholds are shown in blue (crosses). There were no clinically significant air-bone gaps (bone conduction thresholds not shown).
