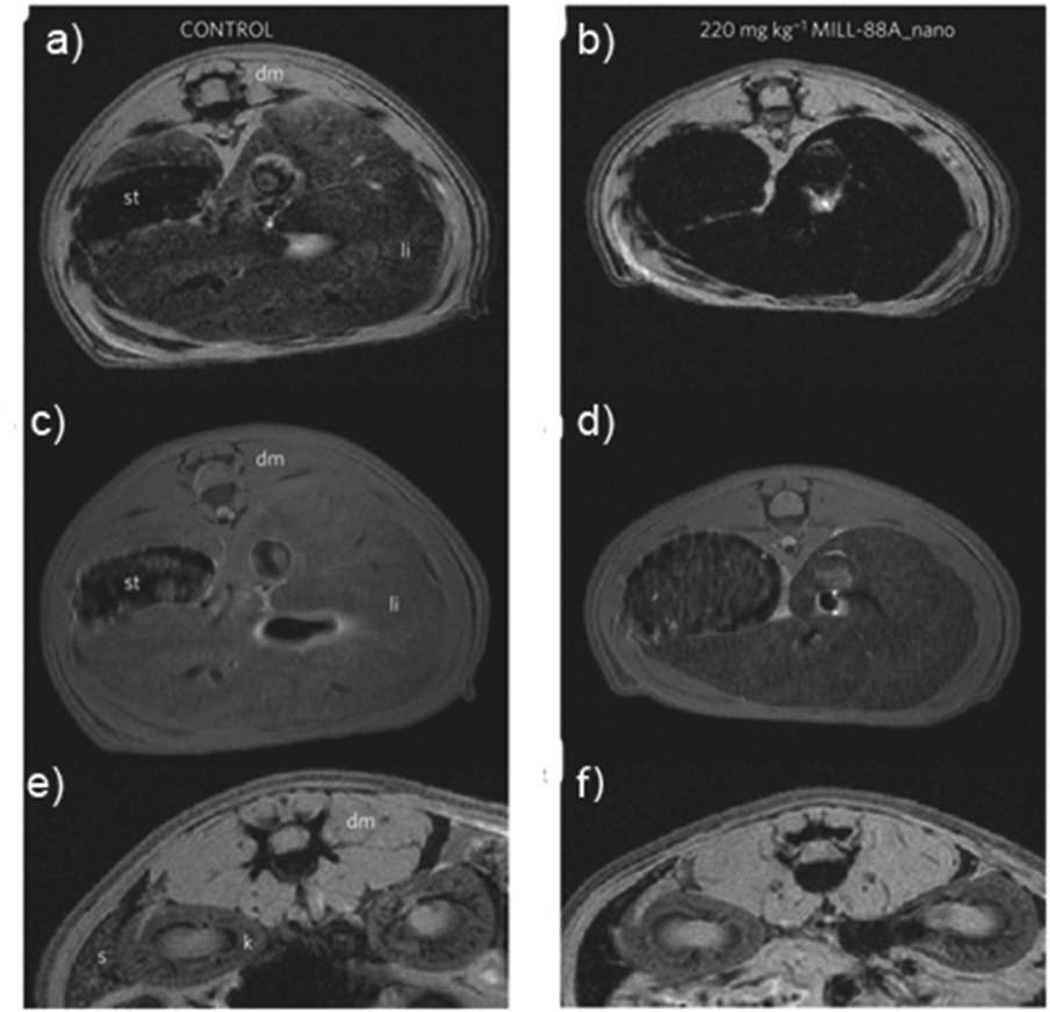
Figure 11.
T2 weighted MR images of Wistar rats injected with no particle (a,c,e) or 220 mg/kg MIL-88A (e,d,f). The images were acquired using either gradient echo (a,b,e,f) or spin echo (c,d) sequences. The images show the liver (a–d) or spleen (e,f) regions 30 minutes post-injection. [dm=dorsal muscle, k=kidney, li=liver, s=spleen, st=stomach]. Reproduced with permission from reference [14]. Copyright Nature Publishing Group 2010.

