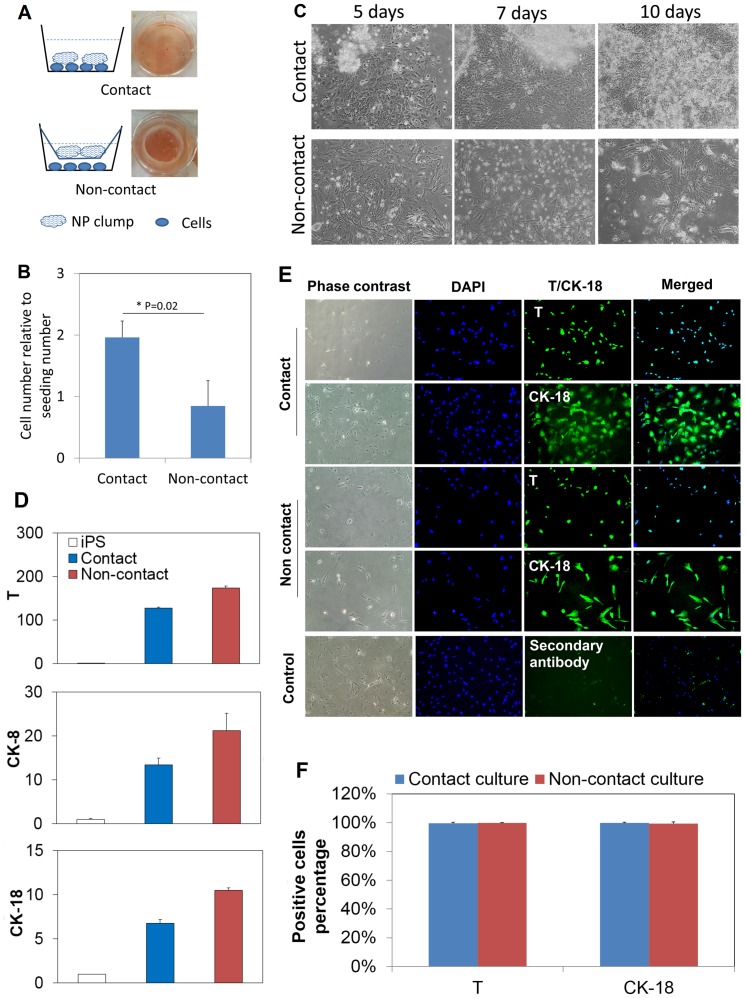
Figure 2. Notochordal differentiation of hiPSCs under the influence of porcine NP tissue matrix.
(A): Illustration of the culture setups to allow or prevent direct contact between cells and porcine NP matrix. For the non-contact culture, the porcine NP tissue was placed in an insert with micro-openings that allow molecules transportation. Digital pictures of the cultures were shown on the right side of each schematic. (B): Cell numbers were counted after 10 days, which were reported relative to the initial plating numbers. The direct contact culture yielded 2 folds of numbers after 10 days which is remarkably higher than that of non-contact culture. *: p<0.05, n = 3. (C): Phase contrast images of cells in the culture wells. Some NP clumps became to attach to the culture well surface and came into contact with cells at approximately 7 days. Compact colonies were formed up to 10 days. Cells numbers appeared to increase over time in the contact culture. In contrast, many cells died at approximately 7 day, and much less cells were observed after 10 days. Magnification for all images: 100x. The observation is in good consistence with the quantification result. (D) Transcript of notochordal marker genes at day 10. Brachyury (T), cytokeratin-8 (CK-8) and cytokeratin-18 (CK-18) were all up regulated in both contact and non-contact cultures. The data are reported in relative mRNA expression which was analyzed by 2−ΔΔCt method using undifferentiated hiPSCs as reference. Three biological samples were pooled and measured so that each result represents the average of three replicates. (E): Immunocytochemical staining images for the contact and non-contact cultures. Control group was omitted with primary antibody. DAPI: blue; T or CK-18: green. Magnification for all images: 100x. (F) Quantification of the positively stained cell numbers based on the immunocytochemical staining images. Total cells were counted based on DAPI staining. The reported results were averaged from four randomly selected images for each staining (n = 4).

