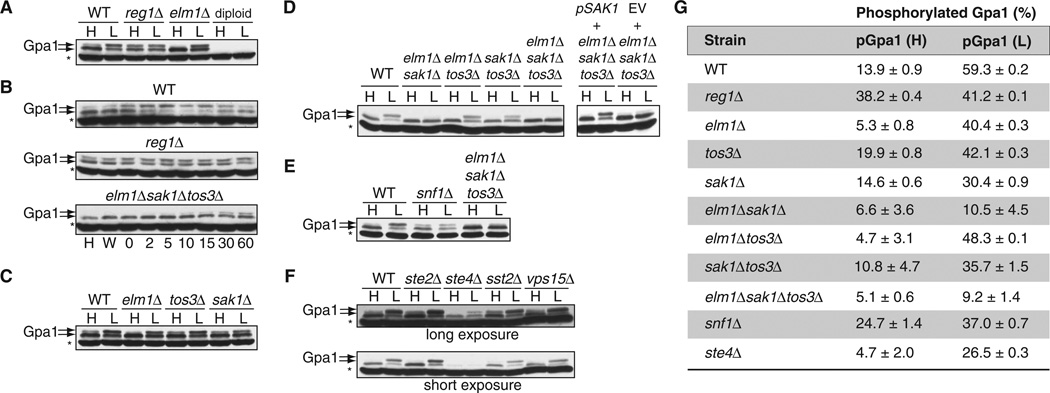
Fig. 1. Gpa1 is phosphorylated in cells cultured under conditions of low glucose availability.
(A) Wild-type (WT), reg1Δ, elm1Δ, and diploid yeast strains expressing endogenous GPA1 were grown in yeast extract, peptone, and dextrose (YPD) containing 2% [high (H)] or 0.05% [low (L)] glucose and were analyzed by Western blotting with an anti-Gpa1 antibody. Treatment with 0.05% glucose was performed for 5 min after cells had undergone log-phase growth in YPD containing 2% glucose. Diploid cells do not have Gpa1 and thus were used as a negative control for the antibody. Gpa1 was detected in two bands indicated by the arrows; the upper band corresponds to the phosphorylated protein. The asterisk denotes a nonspecific band. (B) Time-course analysis of Gpa1 phosphorylation. WT, reg1Δ, and elm1Δsak1Δtos3Δ strains were grown in 2% glucose (H), were washed in 0.05% glucose (W), or were grown in 0.05% glucose for the indicated times (in minutes). Cell lysates were analyzed by Western blotting with an anti-Gpa1 antibody. (C) Analysis of Gpa1 phosphorylation in yeast strains singly deficient in kinases that phosphorylate Snf1. WT cells and the indicated strains were treated as described in (A) and were analyzed by Western blotting with anti-Gpa1 antibody. (D) Left: Analysis of Gpa1 phosphorylation in WT cells and in the indicated double and triple kinase–deficient strains treated as described in (A). Right: Effect of reconstitution of the triple kinase–deficient strain with plasmid encoding Sak1. Yeast cells deficient in Elm1, Sak1, and Tos3 were transformed with empty vector (EV) or with plasmid encoding Sak1, treated as described in (A), and then analyzed by Western blotting with antibody against Gpa1. (E) Comparison of the responses of the snf1Δ strain to high and low glucose with those of WT cells and the elm1Δsak1Δtos3Δ strain. Cells were treated and analyzed as described in (A). (F) Effect of the loss of Gpa1 signaling components on its phosphorylation. Top: WT cells and the ste2Δ, ste4Δ, sst2Δ, and vps15Δ strains were treated and analyzed as described in (A). Bottom: Shorter exposure of the Western blot shown above. (G) Quantitation of the abundances of phosphorylated Gpa1 (pGpa1) protein in the indicated strains exposed to high- or low-glucose conditions as determined by densitometric analysis of bands from three individual experiments. The amount of pGpa1 protein in each strain is expressed as a percentage of the amount of total Gpa1 protein. Western blotting data in (A) to (F) are representative of three independent experiments, except for (B), which is representative of two independent experiments.

