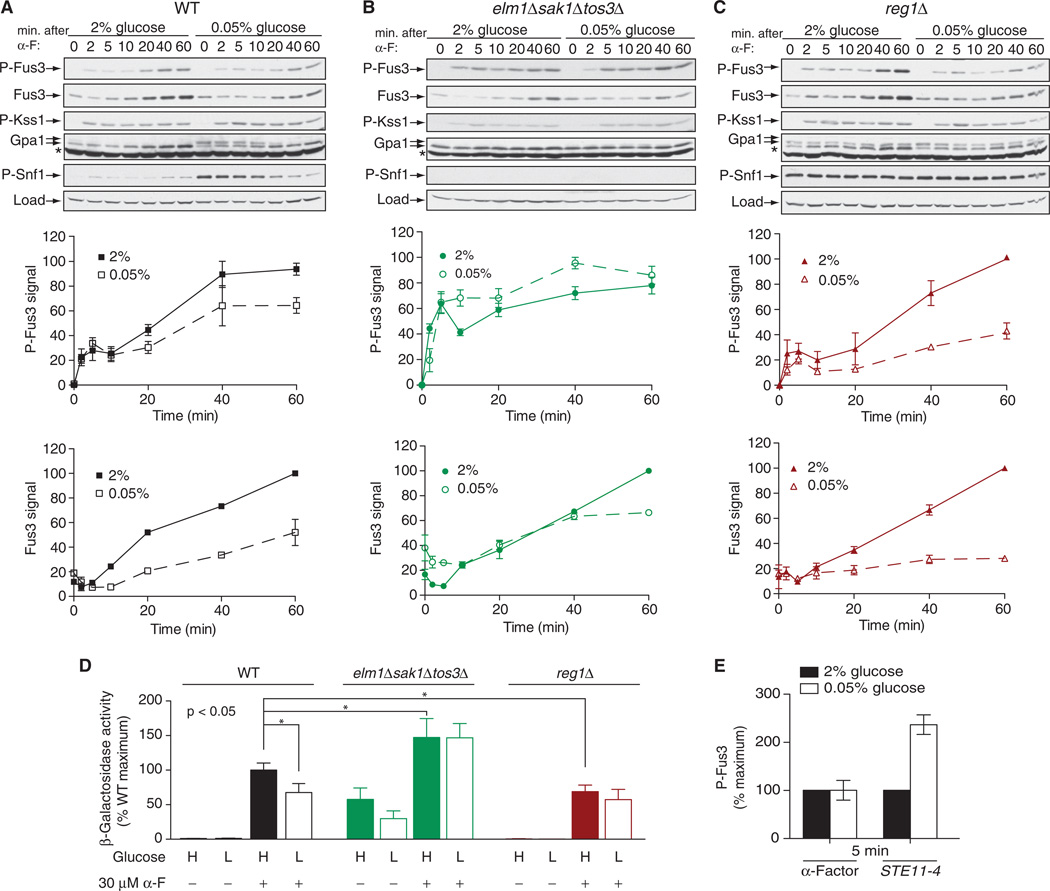
Fig. 4. Crosstalk between mating and glucose-sensing pathways.
(A to C) Analysis of the effects of high and low glucose on the abundance and phosphorylation of Fus3. (A) WT cells, (B) elm1Δsak1Δtos3Δ cells, and (C) reg1Δ cells were cultured in medium containing 2 or 0.05% glucose for 5 min before being left untreated or treated with 3 µM α-factor (α-F) for the indicated times before they were harvested for analysis. Top: Samples were analyzed by Western blotting with antibody against phosphorylated p44/42 MAPK (to detect p-Fus3 and p-Kss1), as well as with antibodies specific for total Fus3, Gpa1, phosphorylated Snf1 (p-Snf1), and G6PDH, which was used as a loading control. Middle: Densitometric analysis of the abundance of p-Fus3. Bottom: Densitometric analysis of the abundance of total Fus3. For densitometric analysis, the most intense band on each blot was set at 100%, and the intensities of the other bands were expressed as percentages of the maximum. Results are means ± SEM from three independent experiments. (D) Analysis of pheromone-dependent gene transcription in WT, elm1Δsak1Δtos3Δ, and reg1Δ cells expressing a FUS1-lacZ reporter that were left untreated or treated with 30 µM α-factor for 90 min in medium containing either 2 or 0.05% glucose. Data are expressed as percentages of the β-galactosidase activity of pheromone-treated WT cells cultured in 2% glucose, which was set at 100%. Data are means ± SEM from three independent experiments, each performed in quadruplicate. *P < 0.05. (E) WT cells were transformed with empty plasmid or with plasmid encoding STE11-4, a constitutively active mutant of the MAPKKK Ste11. Early–log phase cells were resuspended in medium containing either 2 or 0.05% glucose. Cells transformed with empty plasmid were treated with 3 µM α-factor for 5 min, whereas cells expressing STE11-4 were collected 5 min after resuspension in fresh medium. Samples were analyzed by Western blotting with antibodies against phosphorylated p44/42 MAPK and total Fus3. Bar graphs represent densitometric analysis of the intensities of bands corresponding to p-Fus3, normalized to those corresponding to total Fus3. For each set of cells, the abundance of p-Fus3 in 2% glucose was set at 100%. Data are means ± SEM from three independent experiments.

