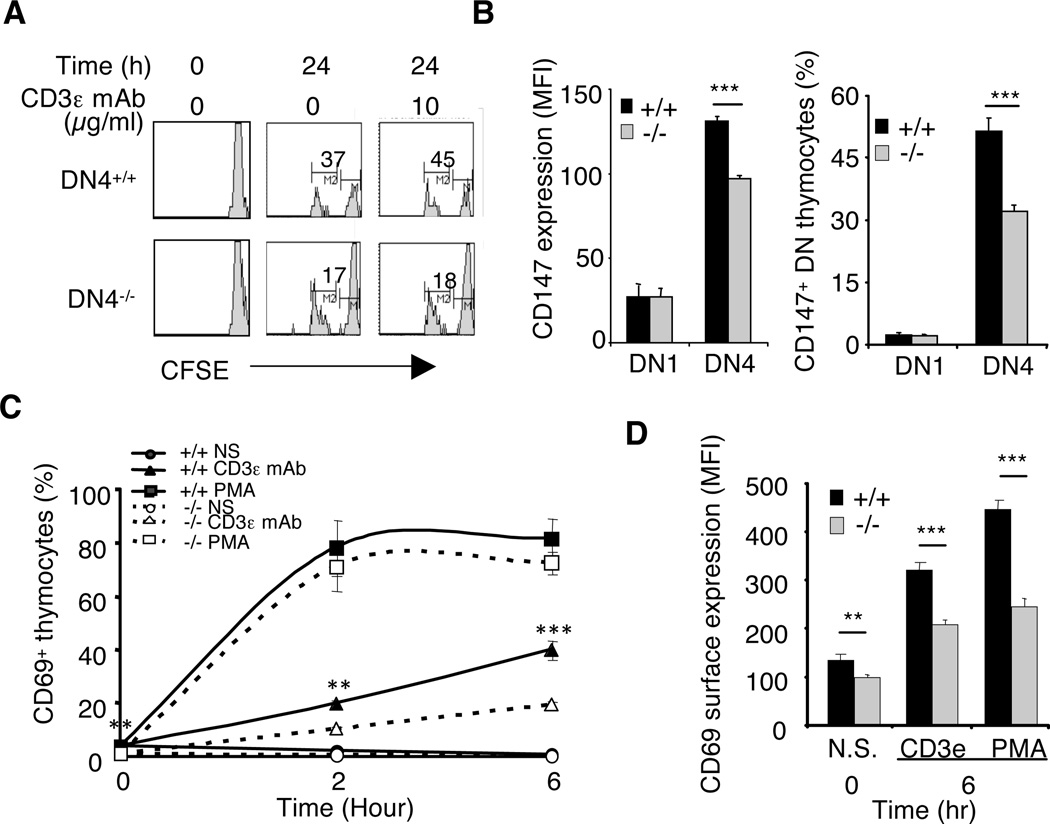
Figure 3. Rictor-deficiency caused suboptimal proliferation and cell activation.
A. RictorT+/+ and rictorT−/− thymocytes were labeled with CFSE and cultured ex vivo for 24 hrs with or without 10 µg/ml of anti-CD3ε mAb. Cells were stained for TCRβ, CD4, and CD8β prior to measuring the fluorescence of CFSE in DN cells. The intensity of fluorescence decreases with each round of cell division. Shown is a representative experiment out of three. B. Thymocytes were stained for TCRβ, CD4, CD8, CD25, CD44 and CD147 and the relative number of CD147+ cells as well as the MFI of CD147 was analyzed by flow cytometry (n=5). C. Thymocytes were cultured ex vivo in presence or absence of 10 µg/ml of anti-CD3ε mAb or 16 nM PMA for the indicated times, stained and the relative number of DP cells expressing CD69 was analyzed by flow cytometry (n= 3). D. MFI of CD69 upregulation in response to 6 hrs anti-CD3ε mAb (10 µg/ml) or PMA (16 nM) treatment (n= 3).

