
Figure 2. Biophysical properties of R225P.
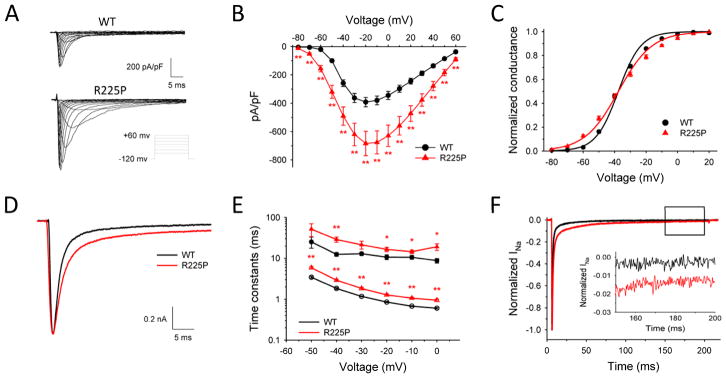
Biophysical properties of NaV1.5-R225P. (A) Representative traces of WT (top) and R225P (bottom) sodium channels. (B) Current-density/voltage plots of WT and R225P. (C) Voltage dependence of activation for WT and R225P from −80 to +20 mV. (D) Representative traces of WT and R225P illustrating altered activation and inactivation kinetics. (E) Voltage-dependence of inactivation time constants (open symbols represent fast component; closed symbols represent slow component) for WT and R225P. (F) Representative TTX-subtracted whole cell current for WT and R225P. Persistent current was measured over the final 10 ms of a 200 ms pulse to −20 mV and normalized to peak current. Inset shows persistent current over the final 50 ms. All data are represented as mean ± S.E.M for n=11–18 cells.