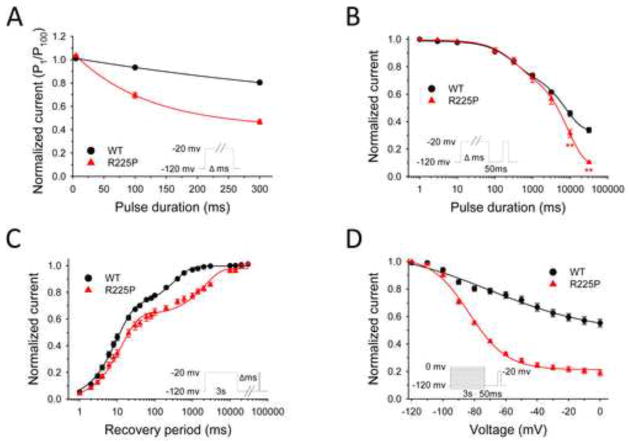
Figure 4. Frequency-dependent channel rundown and slow inactivation.
NaV1.5-R225P stabilizes the slow-inactivated state. (A) Frequency-dependent channel rundown of WT (black) and R225P (red) observed for activating pulse durations of 5, 100, and 300 ms. Curves were fit with exponential decay functions. (B) Onset of slow inactivation for WT and R225P. (C) Recovery from slow inactivation. WT (black line) and R225P (red line) data fit with double-exponential curves. (D) Voltage-dependence of slow-inactivation of WT and R225P. Curves are the result of data fittings with the Boltzmann function. All data are represented as mean ± S.E.M for n=7–15 cells.

