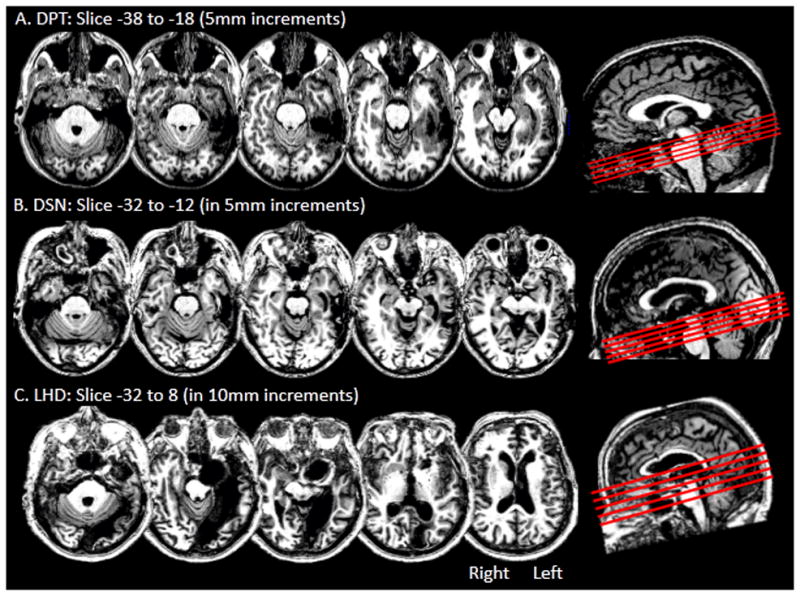
Figure 3.

Axial slices depicting the brain lesions in the left ventral occipitotemporal cortex for (A) DPT, (B) DSN, and (C) LHD. The slices were rotated −15 degrees from the AC-PC line and are shown in a sagittal view as red lines in the right side box.
