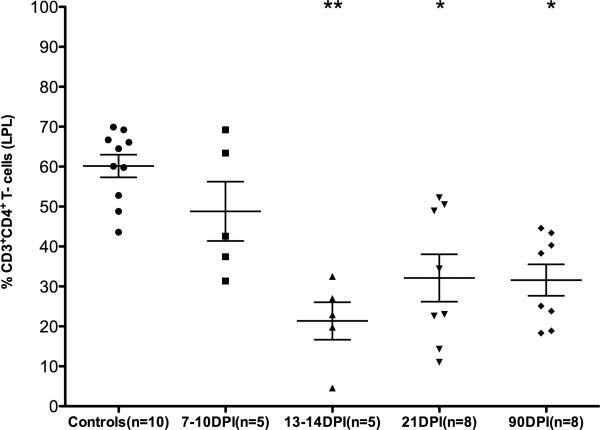
FIGURE 1.
Percentage of CD4+ T cells among lamina propria leukocytes (LPLs) isolated at different time points after SIV infection. The cells were first gated on singlets followed by lymphocytes, CD3 and then on CD3+CD4+ T cell subsets. Data analysis using Kruskal-Wallis test identified significant differences among the different groups (p=0.0004). Post-hoc analysis using Dunn's multiple groups comparison identified 13-14, 21 and 90DPI time points to be significantly different from uninfected controls. Single asterisk (*) = p<0.05 and double asterisk (**) = p<0.01. The error bars represent standard error of mean CD4+ T cell percentage within each group.

