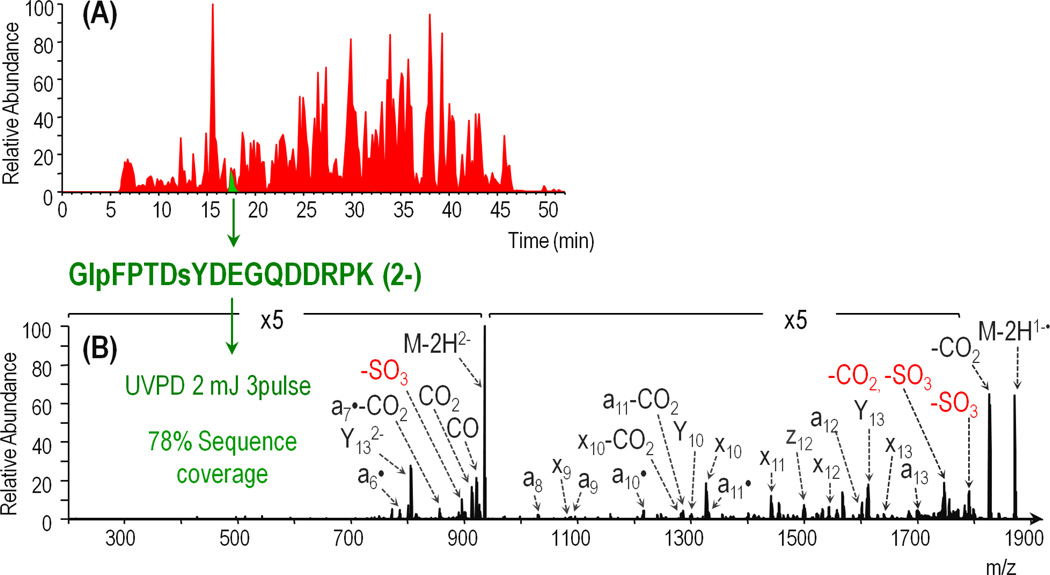
Figure 5.
A) Base peak chromatogram of tryptic bovine fibrinogen (red) with extracted ion chromatogram for sulfopeptide GlpFPTDsYDEGQDDRPK (2-) from the fibrinogen beta chain (green) overlaid. B) Negative UVPD mass spectrum (three pulses at 2 mJ) of GlpFPTDsYDEGQDDRPK (2-) from the average of 18 MS/MS scans acquired over 12 seconds. SO3 neutral loss products are annotated in red.

