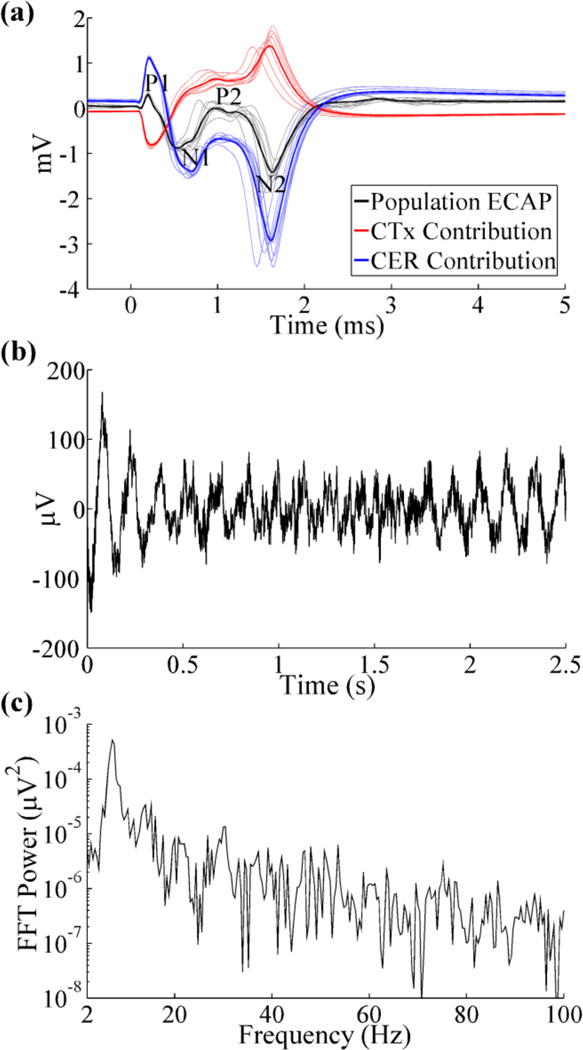
Figure 2.
Evoked compound action potential (ECAP) and local field potential (LFP) signals recorded with the Medtronic 3387 electrode. (a) Composite ECAP response with 3 V DBS, and individual contributions from activation of CTx and CER inputs. The average ECAP and single responses are shown in the bold and light traces, respectively, and phases of the ECAP are labeled. (b) LFP signal arising from intrinsic network activity. The LFP magnitude (standard deviation) was 37.04 µV. (c) FFT power spectrum of LFP signal from (b), with a peak frequency at 7.2 Hz.

