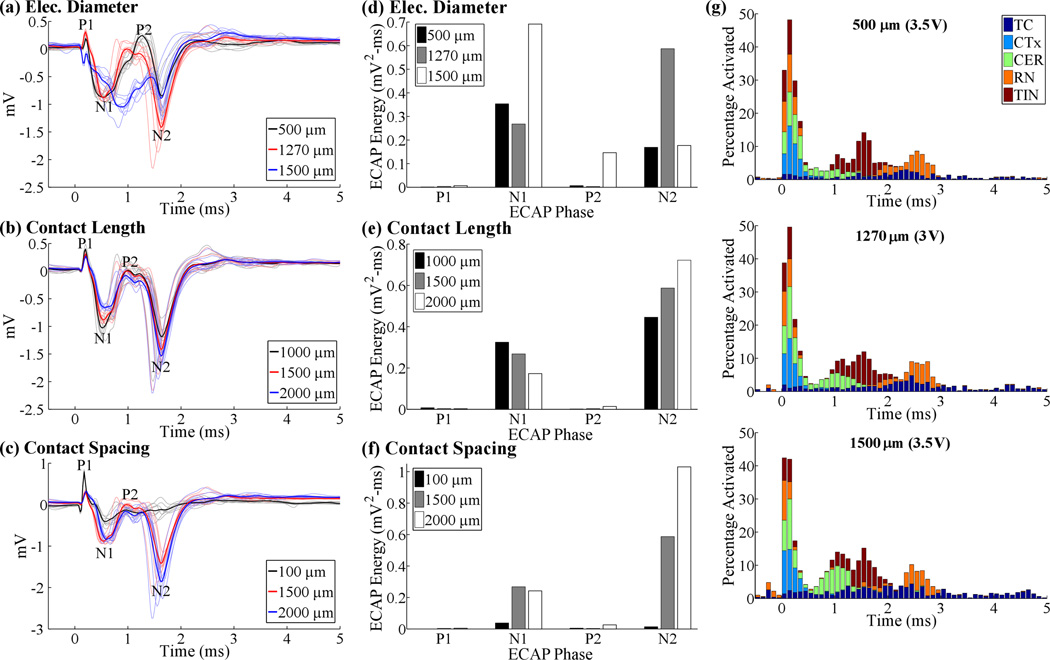
Figure 6.
ECAP responses across electrode geometries, including electrode diameters (a), recording contact lengths (b), and contact spacings (c). The initial negative and positive peaks of the ECAP with a 100 µm contact spacing in (c) corresponded to a residual stimulus artefact. DBS amplitude was 3 V for all electrode designs except with diameters of 500 or 1500 µm, for which DBS amplitude was increased to 3.5 V. (d-e) Signal energy of each phase from the corresponding ECAP responses in (a-c). (g) Neural activation for the three electrode diameters tested. Data presentation is as in figure 4(b).

