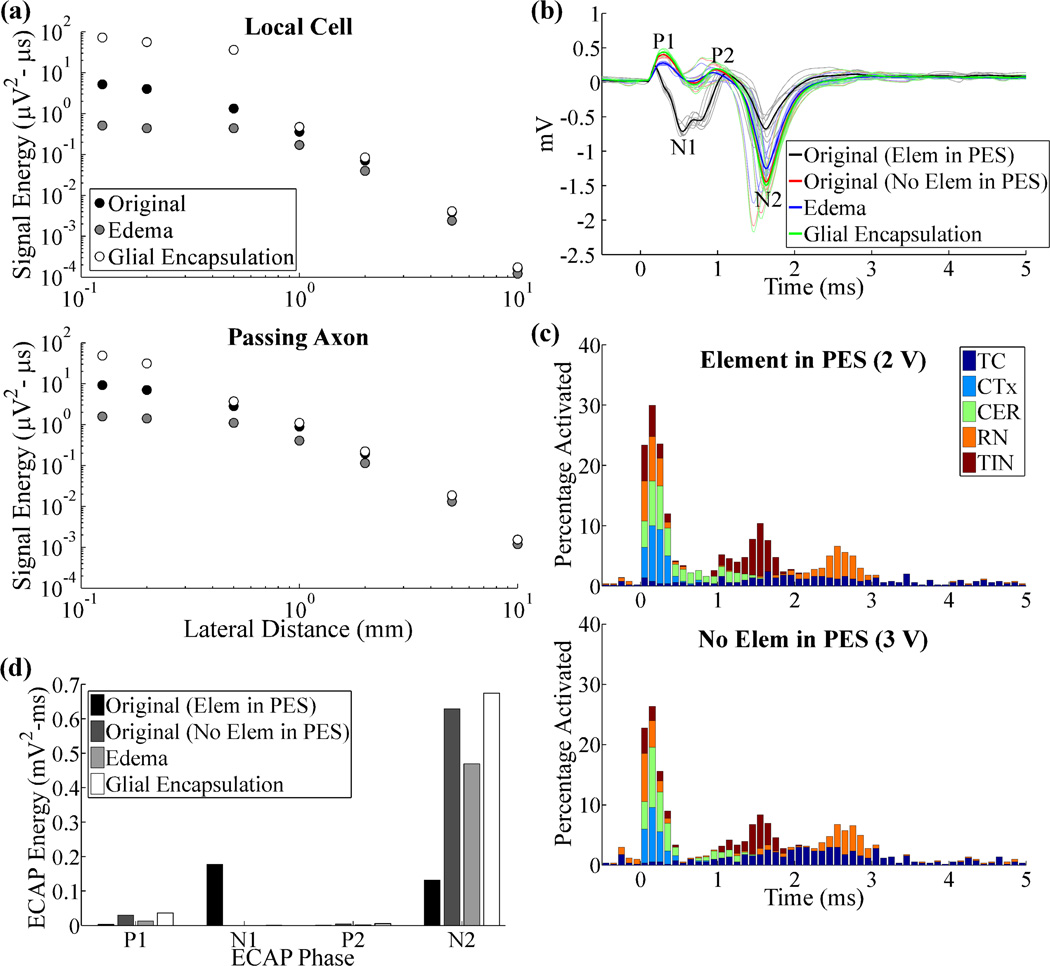
Figure 7.
Neural responses recorded in the original, acute edema, and chronic glial encapsulation models. (a) Signal energy from single neurons versus lateral distance between the electrode and the local cell or passing axon. (b) ECAP responses for the original model with and without elements in the peri-electrode space (PES), and for the edema and glial encapsulation models, with no elements in the PES. DBS amplitude was 2 V with neurons in the PES, and 3 V otherwise. (c) Neural activation for the conditions tested in (b). Data presentation is as in figure 4(b). (d) Signal energy of each phase from the ECAP responses in (b).

