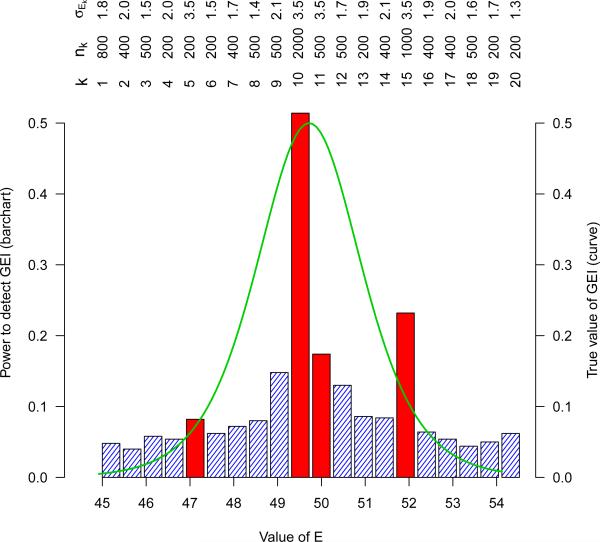
Figure 2.
Non-linear GEI model: the height of the bars represent the power to detect GEI across individual studies; the (green) curve shows the value of the true non-linear GEI parameter; the top panel shows the sample sizes nk and the within study standard deviations σEk of E, the four studies with relatively greater σEk are highlighted (in red).

