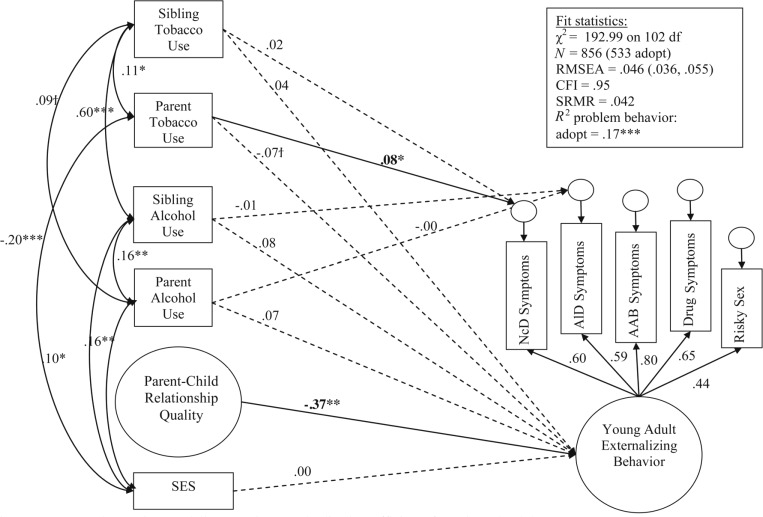
Figure 3.
Structural equation modeling results: Standardized coefficients for adopted adolescents. Significant paths are denoted by †p < .10; *p < .05; **p < .01; ***p < .001. All independent variables (left side of diagram) were correlated and assessed in adolescence for clarity of presentation. Correlations that were not significantly different from zero are not shown (see Table 3 for all correlations). Also, nonsignificant paths between independent and dependent variables were dashed. SES = socioeconomic status; RMSEA = root mean square error of approximation; CFI = comparative fit index; SRMR = standardized root mean square residual; adopt = adolescents who were not genetically related to parents or siblings; NcD = nicotine dependence; ALD = alcohol dependence; AAB = adult antisocial behavior.

