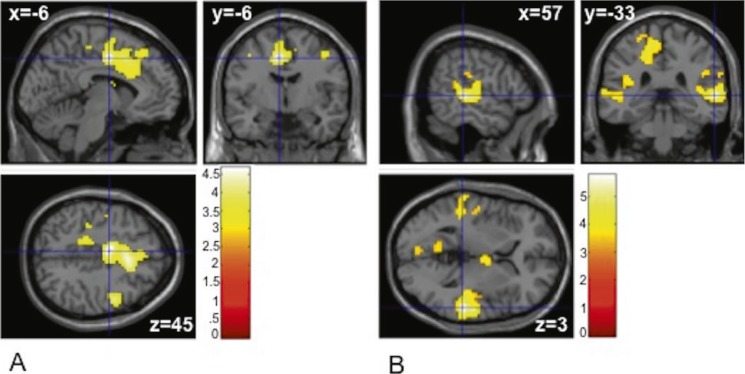
Figure 3.
Multiple regression: Alcohol Use Disorders Identification Test (AUDIT) and Timeline Followback (TLFB) scores and brain activation across the whole brain. (A) Brain regions showing activation associated with AUDIT total score in the CRAlcohol - CRControl contrast. (B) Brain regions showing activation associated with TLFB total drinks in the CRAlcohol -CRControl contrast. The color bar represents voxel T value.

