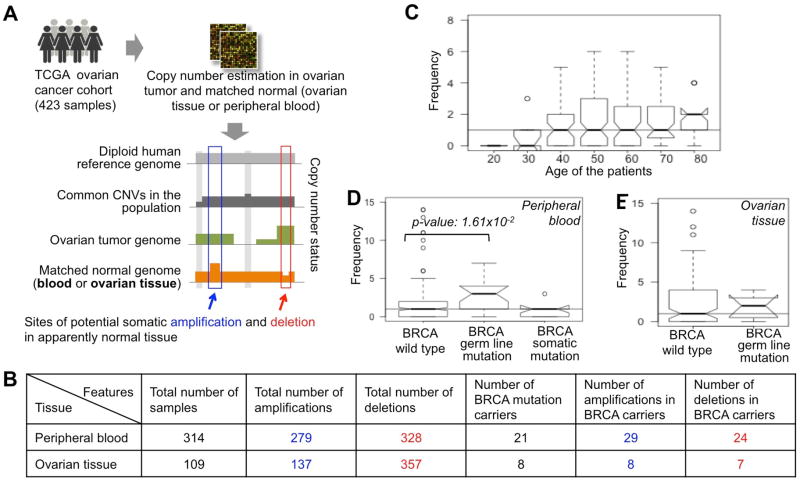
Figure 1.
(A) The pipeline for detecting of somatic amplifications and deletions in apparently normal peripheral blood and ovarian cancer tissue of the TCGA ovarian cancer patients. (B) Summary statistics of somatic amplifications and deletions in peripheral blood and ovarian cancer tissue in the cohort. The BRCA mutation carriers are shown categorically. (C-E) The number of somatic genomic alterations (amplifications and deletions) per (C) peripheral blood sample, grouped according to the age of the individuals, (D) peripheral blood sample, grouped according to BRCA mutation status, and (E) ovarian tissue sample, grouped according to BRCA mutation status. The horizontal line shows the median value across all the samples in respective panel.

