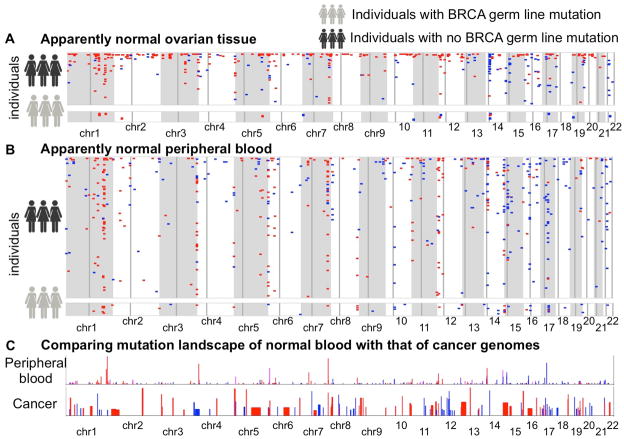
Figure 2.
Genome-wide mutational landscape showing pSCNAnorm ( amplifications: blue, deletions: red) in apparently normal (A) ovarian cancer tissue and (B) peripheral blood of the ovarian cancer patients. Each row represents an individual. Chromosomes are indicated below. Faint vertical lines in each chromosome indicate centromere. Only the individuals with at least one detectable pSCNAnorm in the cohort are shown. The individuals with germ line BRCA1 or BRCA2 mutations are shown separately. (C) Comparing the mutation landscape of apparently normal peripheral blood with that of 26 different cancer types combined, as analyzed by Beroukhim et al. Nature. 2010. The balance of blue and red shades indicates the proportion of amplifications and deletions. Heights of the bars indicate prevalence of such events in the genome.

