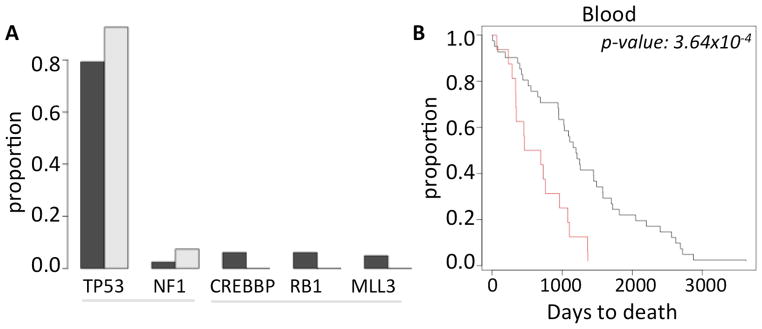
Figure 3.

(A) Frequency of the common cancer gene mutations in ovarian cancer patients who had no pSCNAbl (black) and those who have ≥4 pSCNAbl (grey). (B) Kaplan Meier curve showing difference in the survival patterns between the ovarian cancer patients who have no pSCNAbl (black) and those who have ≥4 pSCNAbl (red). The difference was statistically significant ( log rank test, p-value 3.64×10⁻⁴).
