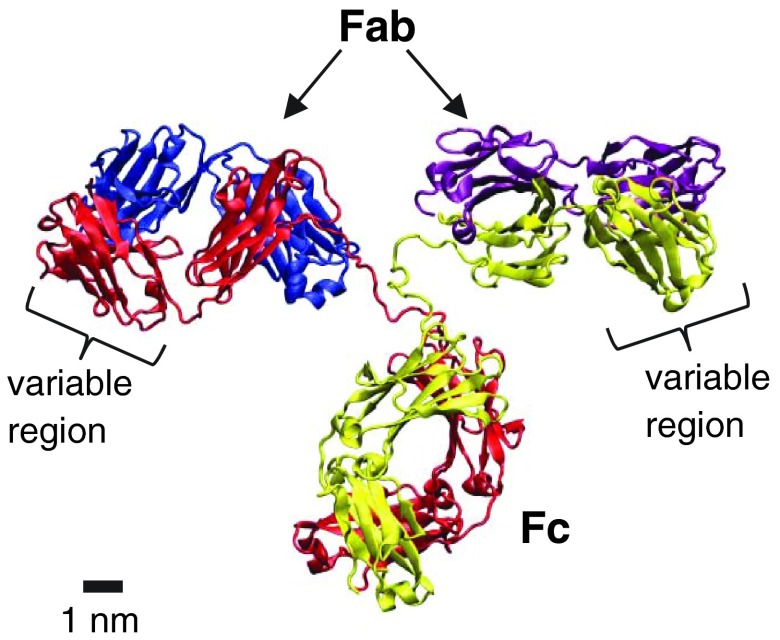
FIG. 1.
X-ray crystallographic structure of an IgG molecule. The graph is generated from the data (DOI: 10.2210/pdb1IGT/pdb) in the Protein Data Bank using VMD 1.9.1 and POV-Ray 3.6. In this graph, two identical heavy chains (red and yellow) and two identical light chains (blue and purple) consist of two identical “antigen-binding domains” (Fab) and one “crystallizable domain” (Fc).

