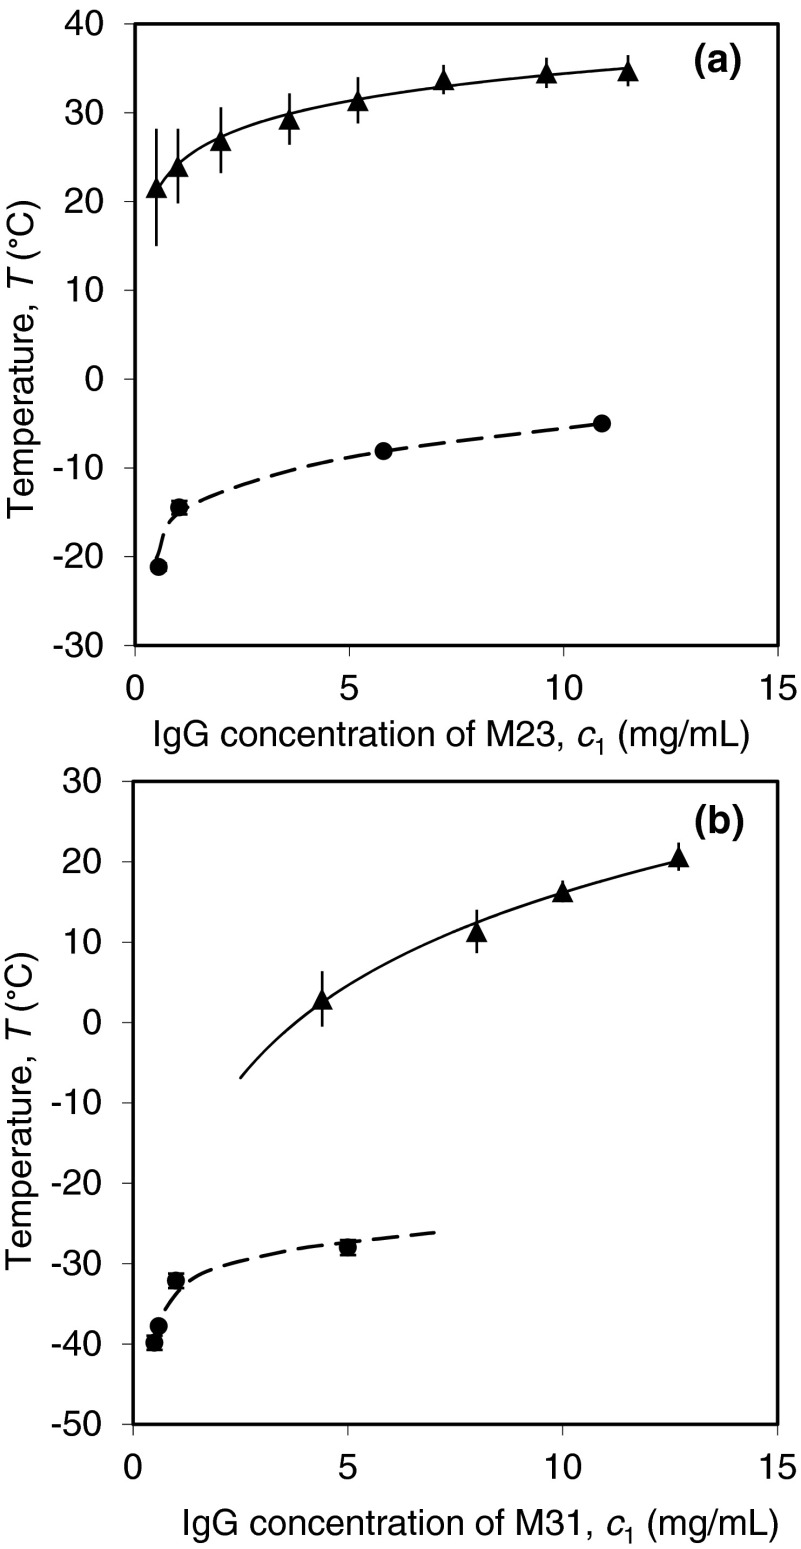
FIG. 8.
Phase diagrams of two IgG cryoglobulins (a) M23 and (b) M31. The solid triangles represent the solubility data points reported in Ref. 15. The vertical bars indicate the hysteresis between the temperatures of growth and dissolution of crystals. The solid curves are the exponential fittings for the liquidus line of crystallization. The solid circles represent the LLPS of the pure IgGs obtained by extrapolating the experimental results of PEG-induced LLPS. The dashed curves are eye guides for the coexistence curves.

