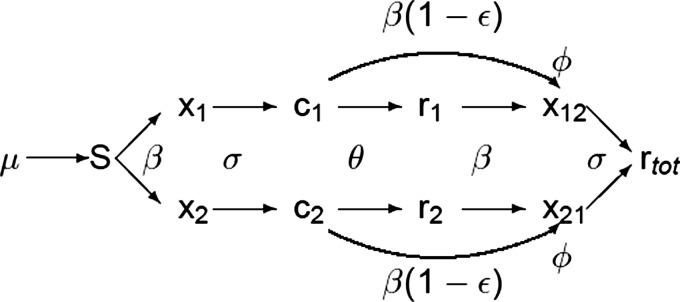
FIG. 1.

Flow diagram of how an individual would proceed through the model in the case of two serotypes. Note the reduction of susceptibility to a secondary infection through the cross immunity factor and the enhancement of secondary infectiousness due to the ADE factor . Death terms for each compartment are not included in the graph for ease of reading.
